Highlights
-
•
In-depth analysis of monopile foundations for offshore wind turbines, current challenges and shortcomings.
-
•
Examination of complexities in soil damping ratio for monopile foundations.
-
•
Performance assessment of design methodologies: PISA 3D, REDWIN, API p-y curves, PISA 1D model, and new ISO/API p-y curves.
-
•
Quantitative analysis of design methodologies for monopile OWT’s foundations and it’s comparison with 3D FEA (Plaxis 3D).
Abstract
This research comprises an in-depth review of monopile foundations for offshore wind turbines under monotonic and cyclic loads. The review study was complemented with performance evaluation of the current design methodologies using advanced finite-element analyses. Overview of intricate nature of pile-soil interactions conducted yielded inadequacy of conventional monotonic p-y curves, which were historically tailored for the oil and gas industry. The paper dives into the effects of cyclic loads on soil stiffness around monopile foundations which indicated dissensus in the scientific community. In the realm of soil damping for monopile foundations, the study underscores the complexities of damping and the general neglect of directly calculated soil damping ratio. Performance assessment of various design methodologies is central to this research. By comparing the conventional API p-y curves, the PISA design method, and the new ISO/API p-y curves with three-dimensional finite element analyses, a discerning evaluation emerges, pinpointing the strength and drawbacks of the current engineering methodologies. Overall, the study concludes the pressing need for refined, evidence-based geotechnical strategies in the realm of monopile foundation design and assessment.
Keywords
Offshore wind turbines
Monopile foundations
Soil-foundation interaction
Environmental loads
1. An introduction to offshore wind energy and monopile foundations
Renewable energy is becoming increasingly important in the global energy mix to reduce greenhouse gas emissions and increase energy security. Among the different forms of renewable energy, wind power has emerged as one of the most promising sources. Wind energy can contribute significantly to energy security by diversifying a country's energy mix and reducing dependence on fossil fuels, helping countries become more resilient to energy supply disruptions and reducing their exposure to price fluctuations in fossil fuel markets. In addition, wind energy is a clean energy source that does not emit greenhouse gases or other pollutants that are harmful to the environment. Offshore wind, as a leading green energy source, is currently considerably attractive due to the vast number of coastal areas on the earth, where the smoother sea surface creates stronger and less turbulent wind (Kaynia, 2019).
According to the DNV outlook for 2050, renewable energy sources such as wind, solar, and hydropower will have a dominant share of the electricity system by 2050 (DNV, 2022). Renewables will account for 83% of grid-connected electricity, reducing the share of fossil fuels in the overall energy mix to just below 50%; despite facing short-term challenges related to raw material costs, solar and wind power growth is expected to continue, with a predicted 20-fold and 10-fold growth, respectively by 2050. Meanwhile, nuclear, gas-fired, and coal-fired energy sources will remain the frontiers of conventional non-renewable energy.
A significant shift in the competitiveness of renewable power generation options since 2010 has already been observed (IRENA, 2022) (see Fig. 1). Between 2010 and 2022, the global weighted average levelised cost of electricity (LCOE) for offshore wind fell by 60%. In 2022, more than 67% (equivalent to 163 GW) of newly implemented renewable energy capacity came in at a lower cost than the most economical coal-fired alternatives worldwide. Compared with benchmark gas LCOE of $93/MWh (BloombergNEF, 2022), it underscores the significant importance of competitively priced renewable energy sources in tackling energy and environmental challenges.
 Fig. 1
The foundation represents the most critical part of the Offshore Wind Turbine (OWT) system. Depending on the foundation type, the sea-water depth and soil characteristics (Fig. 2), the cost of the foundation varies between 25% and 34% of the project (Díaz and Soares, 2020).
 Fig. 2
Market survey investigations conducted by the authors, coupled with further analyses, have revealed that monopile foundations are the preferred foundation type for OWTs in European wind farms (Fig. 3). Approximately 70% of foundations for OWTs with a capacity of less than 5 MW are monopiles. However, for turbines with a capacity ranging between 5 and 8 MW, this figure drops by 24%, with jacket-type structures becoming a notable competitor to monopiles. This is mainly because monopiles are a well-established technology that can be easily adapted to different site conditions and water depths. For example, in the North Sea, the water depth is typically shallow to moderate, making monopile foundations a cost-effective option compared to other foundation types. Additionally, the seabed in the North Sea is mostly composed of sand and gravel, which allows for easier pile installation without requiring extensive drilling efforts. These attractive factors make monopile foundations an attractive choice for offshore wind energy developers, particularly in regions like the North Sea.
 Fig. 3
Additionally, monopiles offer several advantages over other foundation types, such as their ability to resist lateral and axial loads, relatively low cost compared to other foundation types, and their simple installation process. Despite competition from alternative foundation types, such as jacket and gravity-based foundations, monopiles continue to dominate the market and are expected to do so in the foreseeable future.
This research paper conducts a comprehensive examination of offshore wind foundations, focusing primarily on the geotechnics of monopiles. In Section 2, an overview is provided to covers the critical loading conditions and design requirements essential for these foundation systems. Section 3 delves into a thorough analysis of current challenges and recent research findings in the field, especially regarding the monotonic and cyclic responses of monopiles. In Section 4, existing industrial design methodologies are reviewed that address some of the issues highlighted in the preceding section. Finally, in Section 5, the effectiveness of these design methodologies through advanced finite element methods is assessed.
2. Overview of offshore monopile foundations
2.1. Structural description of a typical offshore monopile foundation
Monopiles are large diameter (around 4–11 m) open-ended cylindrical piles under the action of the axial loads from the weight of the structure and lateral loads from environmental loads. The piles are typically made of steel. The open-ended design allows easy pile installation into the seabed, typically by driving it into the soil using a pile-driving hammer.
The connection between the monopile foundation and the turbine tower is a critical component of an OWT design. Currently, the industry employs two design options for this purpose. The first option includes a transition piece that connects the monopile to the turbine tower (Fig. 4a). The transition piece is designed to match the curvature of the monopile and provide a platform for the tower's installation, which is typically secured to the transition piece using a flange connection. Once installed, the monopile is grouted in place to increase its stiffness and provide additional support. Depending on the design, the transition piece may include additional features to improve functionality, such as cable access points or corrosion protection systems. Alternatively, monopiles can be designed with a tapered section above the mudline to accommodate the turbine tower diameter (Fig. 4b). A bolted flange connection is then employed to attach the turbine tower to the monopile above sea level. This design necessitates a platform on the monopile above sea level for tower installation.
 Fig. 4
Despite being an industry practice for many years, recent reports of observed cracks in the grouted connection between the transition piece and the monopile have prompted developers to consider the direct connection between the monopile and turbine tower through a flange connection, which has led to a deviation from the traditional transition piece design to the new designs that address the grouting issues.
2.2. Loads on offshore monopile foundations
To understand the design requirements for monopile foundations, it is essential to examine the nature of loading they encounter. From this perspective two primary types of loads may arise: monotonic and cyclic. Monotonic loading on OWTs refers to a linear and unidirectional application of load, devoid of reversals or cyclic variations. Such loading is primarily influenced by the static weight of the wind turbine components, including the nacelle, blades, tower, and foundation. Additionally, steady environmental forces from quasi-static winds, continuous wave action and tidal effects play a significant role. Operational loads, arising from consistent turbine activities such as the steady-state rotation of the blades and drivetrain torques, also contribute. Cyclic loading, in contrast to monotonic loading, involves repetitive forces that change in magnitude and direction over time. This type of loading in OWTs predominantly stems from variable wind speeds, oscillating wave patterns, and periodic tidal currents, which impose alternating stresses on the monopile foundations. Fig. 5 shows the observed response under both monotonic and cyclic loads.
 Fig. 5
Offshore monopile foundations are subjected to various types of loads (Fig. 6), broadly classified into five groups (Fig. 7), including static (gravity) loads, aerodynamic loads, hydrodynamic loads, operational and control loads, and other loads. Static loads include the weight of the entire structure, including the turbine, tower, and foundation, as well as any additional equipment that may be present on the platform. Aerodynamic loads include the effects of wind on the turbine blades and tower. Hydro-dynamic loads refer to the forces exerted by the water on the foundation, which can be caused by waves, tides, and currents. Operational & Control loads include the loads exerted on the foundation during normal turbine operation, such as 1P and 3P loads, the loads exerted during launch, emergency shut-down procedures and changes in wind direction and speed. Finally, other loads may include transportation, installation, repair and maintenance (TIRM) as well as the seismic loads in earthquake-prone areas, ship impact, tsunami, and wake effect from other turbines.
 Fig. 6
 Fig. 7
The loads on monopile foundations are considered at various magnitudes depending on the probability of occurrence. This ensures that the expected strength and stiffness criteria are met during such events. For example, the loads due to wind and waves are considered in different combinations to calculate the design loads on the structure. These loads are then compared to the various strength and stiffness requirements calibrated for the examined probability of occurrence of the loads to ensure that the structure can withstand the expected loads.
The governing design load on monopiles varies depending on the location of the installation. For example, the primary design criterion in the North Sea is wave loading, while seismic loads are the governing design requirement in the eastern coast of the USA and Japan. Tsunami is a critical design consideration for some areas, such as Taiwan and Japan. These location-specific design criteria have significant implications for the design of monopile structures, as the structures must be able to withstand the specific environmental loads that are governed at the installation site.
The primary focus of this research paper will be primarily on the environmental loads, particularly wind and wave loading. These loads are most encountered and impactful in the majority of offshore wind farm locations. While acknowledging the significance of seismic and tsunami risks in certain specific regions, the authors recognise that these factors do not represent the primary design challenges for the broader scope of offshore wind turbine foundation engineering. This approach allows for a more targeted and relevant analysis of monopile design in the prevalent contexts of offshore wind energy development.
2.3. Industrial design requirements for offshore monopile foundations
The monopile foundation must be designed in accordance with industry standards and guidelines to ensure its functionality, much like many other structures. These codes include various design guidelines, such as those provided by DNV (2011) and IEC (2009) widely practised in Europe. In the recent years there has been various research endeavour to improve these codes of practices. For details of the aforementioned research, reader is referred to Section 4.
Monopiles foundations, when subjected to environmental loads, particularly those from wind and wave loads, exhibit distinct patterns of failing. In the latest code of practices these failure modes are categorised under three distinct failures cases. Therefore, the monopile design must meet the ultimate limit state (ULS), serviceability limit state (SLS), and fatigue limit state (FLS) criteria as a minimum (Fig. 8).
 Fig. 8
ULS failure represents a scenario where monopiles are subjected to steadily applied forces that progressively increase in magnitude, known as monotonic forces. Typically, two primary types of ULS failure are observed in monopiles: geotechnical failure, which involves the collapse of the soil surrounding the monopile (Fig. 8), and structural failure of the monopile itself, such as buckling, yielding, or fracturing under excessive loads. SLS (Serviceability Limit State) failure is characterised by excessive tilt and deformation of the foundation beyond permissible limits, such as notable pile head displacement. While it can be initiated by monotonic loading, it is predominantly caused by cyclic loading. Finally, FLS failure necessitates the prediction of the monopile fatigue life, taking into account the long-term effects of cyclic loading on the foundation integrity.
3. Current challenges and recent research contributions
This section discusses the current scientific challenges in designing monopile foundations subjected to monotonic and cyclic loads. It must be acknowledged that, although piled foundations have historically been used for supporting building loads, a monopile is a relatively novel concept. What distinguishes monopiles from other types of piles previously used, such as in the oil and gas industry, is their stiffness, especially in the lateral direction, due to their large diameter. Currently, monopile foundations supporting offshore wind turbines are approximately 10–11 m in diameter with an embedment length of 40–60 m, resulting in a slenderness ratio between 4 and 6. This indicates that monopiles are significantly stockier than their counterparts in the oil and gas industry, which typically have a slenderness ratio between 20 and 30. Yet, the current industrial design philosophy for monopiles still heavily draws on precedents set by the oil and gas sector. Therefore, we must begin by examining the so-called conventional p-y curves originated by the American Petroleum Institute (API) and their inadequacy for the design of large-diameter monopiles.
3.1. Mismatch between conventional monotonic p-y curves and its application to offshore monopile foundations
Understanding how a pile transfers loads to the surrounding soil is essential in determining its load-bearing capacity. This phenomenon is known as pile-soil interaction and has been the subject of extensive scientific investigation, especially within the oil and gas industry. The origins of pile-soil interaction for laterally loaded piles in the oil and gas industry can be traced back to the 1950s, when the industry started to expand. Since then, numerous studies have been conducted to improve the understanding of pile-soil interaction. In compliance with guidelines set forth by the oil and gas industry, both the American Petroleum Institute (API, 2003) and Det Norske Veritas (DNV GL, 2016) endorse using the p-y curve method for analysing soil-pile interactions in their respective standards.
The conventional p-y curves are based on Winkler model (Beams on Non-Linear Winkler Foundation, BNWF or p-y approach) (Winkler, 1867). These curves represent the relationship between the lateral soil resistance (p) and the pile deflection (y) at a given depth. This model is a widely used approach for modelling the pile-soil interaction in pile foundations. The model represents the soil surrounding the pile as an array of independent springs with a given stiffness value (Fig. 9). In the context of pile-soil interaction, each spring in the Winkler model corresponds to a small segment of the pile length and provides a resisting force proportional to the pile deflection at that segment. The proportionality constant for each spring is termed the “subgrade reaction modulus” or “modulus of subgrade reaction”, often denoted as “k”. The stiffness value of each spring is dependent on the characteristics of the soil, such as its modulus of elasticity and the spacing between the springs. The model assumes that the pile behaves like a beam on an elastic foundation, and the soil springs act as a series of supports.
 Fig. 9
The p-y curves presently employed in the oil and gas industry are grounded in a range of theoretical and empirical research, as delineated in Fig. 10. At the core of this research were experimental studies conducted at Mustang Island, Texas. These studies involved two identical steel piles with a diameter of 0.61 m and a wall thickness of 9.5 mm and were fully instrumented and embedded 21.0 m below the mudline at Mustang Island, Texas. Consequently, the slenderness ratio of the test piles was L/D = 34.4. The data collected from Mustang Island tests were subsequently used by Matlock (1970) and Reese et al. (1974) for developing p-y curves for clays and sandy soil, respectively which were then adopted into API guidelines, and have since become known as API p-y curves.
 Fig. 10
The applicability range of API p-y curves was subject to study by Gazioglu and O'Neill (1984) hiring 58 full-scale laterally loaded tests in clays. The results yielded that the p-y curves proposed from the Mustang Island tests could be used for maximum 2.3 m diameter piles. Therefore, the applicability of the p-ycurves derived from the Mustang Island tests to monopile foundations, particularly those with lower slenderness ratios, is questionable and further research is necessary to develop more accurate and reliable methods for modelling soil-pile interaction in such cases.
It is imperative at this stage to distinguish the divergent responses characteristic of stocky and slender piles to lateral monotonic loading. It must be noted that current monopile foundations have a lower slenderness ratio (typica, L/D ≈ 3–6), resulting in what is known as “stiff (stocky) pile” behaviour. In contrast, the slender piles usually display minimal lateral displacement beyond the top section, as the primary loads from oil and gas structures (e.g., jacket structures) are predominantly axial (Fig. 11). In contrast, stiff piles exhibit a “rigid body”behaviour, rotating around a pivot point, which leads to a pronounced deflection or ‘toe kick’ at the pile base. This is largely because monopiles are predominantly subjected to lateral forces, which generate moment-induced stresses (refer to Table 1 for summary). Therefore, the use of p-y curves for slender piles, which is a standard method recommended in API and DNV guidelines, to model soil-pile interaction for stiff monopile foundations in the offshore wind industry has raised concerns about its applicability.
 Fig. 11
| Rigid (Stocky) pile | Flexible (Slender) pile | |
|---|---|---|
| Pile-soil interaction | The pile acts are a “rigid” body rotating around a pivot point along the length of the embedded length. The pivot point moves vertically as applied load varies. Soil strain is created by (1) lateral pile movement and (2) pile bending causing wall strain that is transferred to the soil next to it. | More flexible and prone to larger deflections and settlements. These deflections can affect the performance of structures supported by the piles, such as excessive tilt or excessive differential settlement. Soil strain around the pile is predominantly created by pile vertical movement. |
| Pile failure | Lower risk of buckling attributed to a reduced slenderness ratio. Yet, failures like local steel yielding or local buckling may prevail. Faces mainly bending stress with less axial stress, increasing fatigue risk. Enhanced ultimate capacity from greater end-bearing resistance. | Higher risk of buckling due to a combination of greater axial and lesser lateral loads, stemming from their high slenderness ratio. Therefore, more prone to buckling overall. Installation fatigue is the governing fatigue case. Reduced ultimate capacity, largely dependent on skin friction. |
| Load transfer | Primarily transfers loads through end-bearing and lateral resistance. The interaction is more pronounced near the surface where bending moments are highest, leading to a significant portion of the load being transferred through bending resistance. | Transfers loads primarily through skin friction along their length. The surface area of the pile in contact with the soil plays a crucial role in load transfer, with axial loads being distributed more evenly along the pile's length. These piles are less reliant on end-bearing resistance due to their design and deeper penetration into the soil. |
There has been a notable effort to gain a deeper understanding of wind turbine foundations and their performance by instrumenting various wind turbine prototypes. This aims to shed light on initially assumed foundation stiffness behaviour and assess its structural integrity over time. Notable studies conducted by Hald T et al. (2009) and Kallehave et al. (2012) have reported results from full-scale wind turbine measurements at the Horns Rev and Walney offshore wind farms, respectively. These investigations have revealed a discrepancy in the stiffness predicted by the American Petroleum Institute (API) p-y curves, indicating that they underestimate the actual foundation stiffness by up to 30–50% during operational conditions. In response to this observation (Kallehave et al., 2012), proposed modifications to the existing API p-y curves, particularly for large diameter monopiles. Their proposed expression for the modulus of soil reaction seeks to account for this greater initial stiffness, offering a more accurate representation of foundation behaviour.
Madabhushi and Haiderali (2013) explored the behaviour of offshore monopile foundations using three-dimensional finite-element analysis. Categorising the piles based on diameter: small (0.61 m and 2.0 m) and large (5.0 m and 7.5 m) while using the elastic-perfectly plastic Mohr-Coulomb soil model, with consideration of combined loads (vertical, lateral, and moment monotonic), the research pursued the effect of pile diameter, clay strength, and stiffness effects on monopile behaviour. The findings showed significant behavioural differences based on pile diameter. For small diameter piles, the bending moment was concentrated at the top, whereas for large diameter piles, it increased from toe to head. Shear force showed a similar pattern. Lateral displacements indicated that small-diameter piles were more flexible, primarily bending, whereas large diameter piles exhibited rigid-like behaviour. Similarly, Liu and Kaynia (2022)conducted a simulation to understand pile behaviour under monotonic loading, focusing on how the length-to-diameter ratio (L/D) of piles influenced pile head displacement, denoted as the y/D ratio. Their findings revealed a linear relationship: as L/D increased, pile head displacement decreased. A comparable linear relationship was also noted by Jostad et al. (2020), utilising the hardening soil small strain model in drained conditions. Many of the aforementioned research have concluded the effects of L/D by considering finite element analysis. Jostad have analysed 4 different models to estimate stiffness displacement and capacity of the monopiles and concluded the significance of defining small strain soil parameters, accumulated strain due to pore water pressure, for accurate definition of soil models, traditionally used in finite element analysis. By hiring experimental methods, Aleem (2022) and Aleem et al. (2022) proposed a Load Utilisation Ratio parameter. This ratio served as an indicator, much like the traditional Factor of Safety and was derived by comparing the foundation load-carrying capacity with the actual applied load magnitude, which comprised a mix of lateral loads and moments.
Haiderali et al. (2015) using three-dimensional soil-pore fluid coupled finite-element analysis revealed that the p-y curves proposed by Matlock (1970)exhibit a soft soil response and consistently underestimate the ultimate soil reaction at various depths, except at the tip of the monopile. The Matlock p-ycurves do not account for the base shear at the pile tip, leading to an overestimation of the soil reaction. Consequently, the lateral capacity of monopiles is significantly underestimated when using the p-y formulation for ultimate limit state analysis. Furthermore, the (Matlock, 1970) p-y formulation results in an excessively low stiffness for soft clay, causing an overestimation of lateral displacement and rotation at the mudline of the monopile. This overestimation leads to a considerable reduction in the serviceability lateral capacity of the monopiles.
As part of distinct project Versteijlen et al. (2017) explored soil-monopile interaction dynamics through field experimentation. The research delves into the application of dynamic load tests on a full-scale, impact-driven monopile. Relevance of pre-installation soil properties, adequacy of existing prediction models and insight from field tests on a single monopile were central to this research. The test monopile was 5 m in diameter and embedded prevalently dense sandy soil for 24 m in Westermeer wind farm. Measured lateral dynamic (small strain) stiffness of the pile was compared to previously developed 1D beam model using effective stiffness method (Versteijlen et al., 2016). It was noted that a best estimate p-y stiffness profile under-estimated the observed soil stiffness with a factor of 2.4 (140% under-estimation). Whereas the 1D effective stiffness method over-estimated the soil stiffness by 20%. This resulted in a stiffness correction factor of 0.8 to achieve the best match between field test results and 1D effective stiffness method. The exploration of conventional p-y curves and their applicability to monopiles has also been advanced by Byrne et al. (2015); Doherty and Gavin (2012) and Roesen et al. (2011) which resulted similar outcome of unfitness of conventional p-y curves for estimation of pile monotonic response.
3.2. Long term performace due to cyclic loading
3.2.1. Accumulation of pile rotation and deflection
The number of loading cycles which an OWT foundation must endure depends on soil and loading conditions. Typically, storms generate approximately 1000–5000 cycles, while the Fatigue Limit State is assessed for 107 cycles. The long-term performance of foundations under cyclic loading remains an aspect not yet fully addressed in design guidelines. The treatment of cyclic loading in the existing design guidelines poses challenges when utilising deteriorated pseudo-static p-y curves. Several critical issues arise from this approach. Firstly, it overlooks the consideration of permanent deformations caused by cyclic loading, potentially underestimating the long-term effects on foundation structures. Secondly, the unique characteristics of cyclic loading, which can significantly impact a structure's stability, are not adequately taken into account. Finally, the analysis does not consider the cyclic properties of the soil, overlooking crucial factors that can influence the overall performance of the foundation. Consequently, relying on empirically derived cyclic degradation factors may result in either overly conservative or underestimated design choices, depending on site-specific conditions. These uncertainties in predicting permanent deformations over the turbine's operational lifetime can have significant implications for the structural integrity and safety of offshore wind turbines.
As per Andersen et al. (2023), the key considerations for designing cyclic foundations include: (1) establishing adequate bearing capacity; (2) ensuring cyclic displacements remain within acceptable limits; (3) estimating appropriate values for soil spring stiffness and damping to facilitate dynamic soil-structure interaction analyses; (4) evaluating permanent long-term displacements under cyclic loading are acceptable; (5) accounting for displacements due to creep and the dissipation of pore water pressure during and after cyclic loading; (6) examining the potential changes in soil reaction stresses at the soil-structure interface due to cyclic loading.
In the conventional p-y curve design method, the modulus of subgrade reaction k was calibrated for flexible slender piles. It is this parameter that defines the initial stiffness, ks, which in turn defines the modal response of the support structure. It is recommended that ks is either calculated using prototype measurement or 3D finite element model. In the p-y design guidelines by API, in the context of cyclic loads, as opposed to the ultimate limit state, the primary alteration in the p-y expression is the constant value assigned to parameter A(Acyclic = 0.9). Consequently, this methodology offers a conservative lower-bound estimate of the response, which remains constant regardless of the number of loading cycles. Recent research by Abadie et al. (2015) on pile response to cyclic lateral loading has shown that repeated periodic loading with a consistent amplitude can lead to substantial accumulations in pile deflection and rotation over time. Additionally, it can bring about changes in the secant stiffness, highlighting the need to consider the dynamic effects of cyclic loading, which are not fully captured by the current static analysis approach. The variation in soil stiffness necessitates a recalculation of the system stiffness to accurately estimate its natural frequency and determine the foundation location in terms of its natural frequency. Consequently, design parameters such as foundation or tower stiffness and system mass should be adjusted if the appropriate natural frequency is not achieved (Bhattacharya, 2014).
Soil element tests typically reveal a significant impact of cyclic loading on soil shear modulus in the large-strain regime, approximately around 0.1% shear strain. However, its effect is more subdued in the small-to-medium strain regime, as depicted in Fig. 12. At very small shear strains, soil behaves almost as a linear elastic material without evident hysteretic damping, as emphasised by Oh et al. (2018). Interestingly, soil shear strength displays variation between drained and undrained conditions. While the dynamic load effect on soil shear strength is minimal under undrained conditions, it noticeably increases in drained scenarios. Central to understanding cyclic loading influence is recognising the degradation of soil shear modulus and the accumulation of shear deformation. Over time, cyclic loading affects the long-term performance of geotechnical structures, leading to increased rotation of monopile foundations, persistent soil deformations, and changes in soil stiffness. Such behavioural shifts introduce a feedback mechanism, further influencing the design criteria for all interconnected system components.
 Fig. 12
Cyclic loading influence on OWTs has attracted considerable attention in the research community. Studies by Madabhushi and Haiderali, 2013, Lau (2015)and Arshad and O’Kelly (2016) have critiqued the traditional p-y approach for its shortcomings in addressing OWT design under repeated lateral loading. Specifically, it falters in accurately predicting strain accumulation in the monopile-surrounding soil and in modelling the intricate soil-pile interactions within the OWT system. Another dimension of cyclic load effects on OWTs is the potential for either soil stiffening or stiffness degradation. While there is a consensus among Achmus et al. (2009a), API (2003) and DNV (2011) regarding the phenomenon of foundation stiffness degradation under repeated lateral loads, which may be due to liquefaction, other studies paint a contrasting picture. Works by Rosquoët et al. (2007), LeBlanc et al. (2010), Adhikari and Bhattacharya (2011) and Cuéllar et al. (2012) provide evidence of soil densification as load cycles increase, underscoring the complex behaviour of soils under cyclic loading conditions.
To achieve the adequate behaviour of cyclic sand ratcheting and densification of sand around the pile, (Liu et al., 2022a, Liu et al., 2022b) adopted the SANISAND-MS model to facilitates a thorough examination of the connection between local soil behaviour and the overall response of monopiles to cyclic loading. Detailed analysis of the model's predictions sheds light on the correlation between soil behaviour and the monopile's global response. Parametric studies conducted through numerical simulations affirmed that the proposed 3D finite element modelling framework replicates key experimental findings regarding monopile-soil interaction.
In a study by Rosquoët et al. (2007), centrifuge tests were executed to examine the impact of lateral cyclic loading on driven piles situated in sand. The characterisation of the cyclic loading sequences was predicated on variables such as the number of cycles, the peak applied load, and the amplitude of the cycle. These tests generated data including pile head displacements, maximum bending moments, and the attendant p-y curves during these cyclic loading sequences. Notably, the most pronounced cyclic effects on the p-y curve were visible in the initial 15 cycles, with manifestations of soil hysteresis suggesting energy dissipation. Interpreting the experimental data on displacement as a function of depth, it was inferred that the cyclic loading predominantly influences the topmost soil strata. This is consistent with the understanding that these layers predominantly dictate the flexible response of the pile to lateral forces.
Achmus et al. (2009) investigated the cyclic response of a monopile foundation in dense and medium dense sandy soil by using a three-dimensional finite-element analysis. The effects of different parameters such as monopile diameter, length and loading state on the performance of the foundation were studied. A series of triaxial tests were conducted to determine the parameters that describe the cyclic behaviour of the soil. The studies reveal that the rate of displacement accumulation strongly depends on the loading level, which is the ratio of the actual load to the ultimate load. A degradation stiffness model was considered for the parametric analyses where various pile geometry, soil density and loading conditions were considered. Two design charts, monotonic and static, were developed based on the degradation stiffness model.
LeBlanc et al. (2010) investigated the response of loose and medium-dense dry sand under cyclic lateral loads using 1g small-scale laboratory tests. Utilising laboratory tests that match the actual dimensions and loading conditions of an OWT monopile, the research presented a non-dimensional framework for stiff piles. The tested pile was subjected to 8000–60,000 cycles within a realistic timeframe. Findings indicate that the accumulated rotation of a stiff pile was predominantly influenced by the cyclic load characteristics. For instance, discrepancies in outcomes between one-way and two-way loading were significant. The obtained results were scaled to full scale. Based on the analysed data, they identified an exponential correlation between accumulated rotation and the number of cycles. Contrary to current design standards (by DNV and API) that use the p-y curve method with a reductive coefficient for soil stiffness during cyclic loading, their results indicated an increase in soil stiffness. The study offers predictive methodologies grounded in experimental results for evaluating stiffness changes and accumulated rotation due to cyclic loading. It proposed modification of foundation stiffness after N number of cycles
This finding underscores the necessity for subsequent studies, especially in examining effects like loading frequency and ensuring the fidelity of methodologies against full-scale data.
In the subsequent research, Lada et al. (2014) aimed to confirm the reliability of the methods used for OWTs by conducting 1g tests on dry dense sand. Static and cyclic tests with 50,000 load cycles were applied laterally on a rigid-assumed monopile foundation, and the results in terms of rotation and soil stiffness were compared with those derived from LeBlanc et al. (2010). They concluded that the accumulated rotation and increase in soil stiffness obtained from the tests on dense sand were significantly larger than those acquired by LeBlanc et al. (2010) for loose and medium-dense dry sand.
Arshad and O’Kelly (2016) focused on dry sandy soil with an initial relative density in the range of 70–74%. The study considered only one pile diameter with a specific embedded depth. Their results highlighted the densification of cyclic stiffness in the soil surrounding the monopile foundation. However, they concluded that further research with more detailed parameters is necessary for a better estimation of soil stiffness performance during cyclic loading.
In summary, soil types exhibit varied responses to repeated cyclic loading (as delineated in Table 2). For example, under continuous cyclic loading, loose to medium-dense saturated sandy soil may undergo liquefaction, leading to reduced soil stiffness and potential impact on pile foundation stability. In contrast, loose to medium-dense dry sandy soil also tends to compact, which results in an increase in soil stiffness (Adhikari and Bhattacharya, 2012). This presents open research questions that the scientific community has yet to address.
| Reference | Soil type | Experimental method | Soil stiffness |
|---|---|---|---|
| Long and Vanneste (1994) | Sand | 34 Full-scale tests | ↓ |
| Little and Briaud (1988) | Sand | 6 Full-scale tests | ↓ |
| Lin and Liao (1999) | Loose, medium & dense sand | Full-scale tests | ↓ |
| Rosquoët et al. (2007) | Sandy | Centrifuge testing | ↑ |
| Achmus et al. (2009) | Sandy | Element tests | ↓ |
| LeBlanc et al. (2010) | Loose & medium-dense dry sand | 1g Small-scale laboratory tests | ↑ |
| Bhattacharya et al. (2011) | Sandy | Physical model tests | ↑ |
| Cuéllar et al. (2012) | Sandy | Experimental and numerical | ↑ |
| Lada et al. (2014) | Dense dry sand | Scaled lab tests | ↑ |
| Arshad and O’Kelly (2016) | Dry sandy soil | Scaled lab tests | ↑ |
| Nikitas et al. (2017) | Drained sandy soil | Element test | ↑ |
| Buckley et al. (2020) | Chalk and tills | Full-scale tests | ↓ |
| Zhang et al. (2017) | Clay | Element tests | ↓ |
| Andersen (2015) | Clay | Element tests | ↓ |
3.2.2. Potential resonance issue
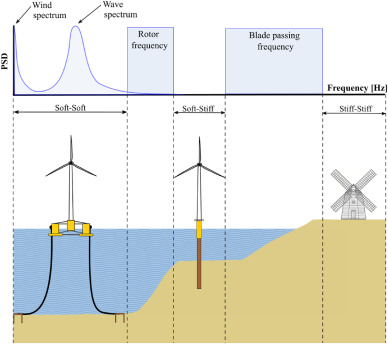
OWT structures are susceptible to dynamic forces induced by waves, as well as 1P and 3P loading as discussed previously. They can become prone to resonance at lower frequencies. The primary concern lies in determining an accurate first mode frequency to assess its proximity to the excitation frequency, thus preventing resonance and potential fatigue failures within the system. The interaction between the structure and the soil, combined with changes in soil properties over time due to various factors, can lead to either a decrease or an increase in soil stiffness. This, in turn, alters the natural vibration frequency of the system, potentially either pushing it into resonance and/or reducing fatigue life. Therefore, it is essential to simulate the soil-structure interaction between the foundation and the soil for cyclic and dynamic loading regimes. Thereafter, stiffness is a fundamental design criterion in addition to the capacity for an offshore foundation. As there are various types of dynamic loads applied to the OWT, and each load has its frequency, it is necessary to be apart from the natural frequency of the system to avoid the resonance problem. In this respect, there are three possibilities for the stiffness of the tower and the foundation of the OWT (Fig. 13), which can be recognised as follows.
-
1.
Soft-soft structures: in this model, the natural frequency lies below the 1P frequency range (turbine rotational frequency range) and is typical for floating offshore platforms.
-
2.
Soft-stiff structures: the natural frequency lies above the 1P frequency range. This type is a common choice for bottom fixed structures as monopiles.
-
3.
Stiff-stiff structures: the natural frequency is above 3P range (turbine blade passing frequency range), and it is used for a massive support structure, which is consequently uneconomic.
 Fig. 13
Designing within the soft-stiff spectrum is particularly intricate due to the narrow frequency range margin between 1P and 3P (Arany et al., 2016). For context, the typical wind turbine frequency stands at 0.3 Hz (Nikitas et al., 2017). Although the loads from 1P and 3P frequencies are lesser than those from wind and waves, their high dynamic amplification makes them noteworthy such as resonance issues recorded in the German North Sea (Hu et al., 2014). Further complexities arise when considering the diverse loading sources. While wind loads, driven by rotating blades, apply lateral forces at the top the tower, wave loads exert shear forces and moments at the top of the foundation. Additionally, in seismic-prone regions, earthquake loads are critical design considerations for OWTs. One should also appreciate the intricacies of soil-structure interactions. Repeated loading cycles and misalignments between wind and wave directions can drastically alter these interactions. Thus, a more profound understanding of monopile behaviour under cyclic loading is pivotal for refining design practices and result interpretation.
3.2.3. Soil damping
In order to accurately predict the dynamic behaviour of an OWT, it is essential to have a precise estimation of the damping present in the entire system. Damping can be defined as the dissipation of the system energy, typically in the form of heat. It plays a pivotal role in constraining the amplitude of dynamic responses and can significantly enhance the fatigue life of the structure. From this perspective, OWTs are subject to a combination of damping originating from various sources. In order to forecast fatigue life and optimise the design of OWTs, it becomes crucial to estimate damping from these diverse sources.
There are four primary sources of damping that influence OWTs, encompassing aerodynamic damping, hydrodynamic damping, structural damping, and foundation (or soil) damping. The overall damping within the system can be computed as the sum of the damping contributions from these various sources (Chen and Duffour, 2018). OWTs are lightly damped structures, and their total damping can vary widely. For turbines in the parked condition, the damping ratio (ξ) as a percentage of critical damping may range from 1 to 3%, while for operational turbines, it ranges from 7 to 10% (Table 3).
| Damping Type | Expected Damping (%) | Reliability |
|---|---|---|
| Aerodynamic | 1.4–8 % | Certain |
| Hydrodynamic | 0.07–0.4 % | Certain |
| Structural | 0.2–2.0 % | Uncertain |
| Soil/foundation | 0.3–3.0 % | Uncertain |
| Total Damping | 7–10 % | Uncertain |
Aerodynamic damping arises primarily from the interaction between the wind turbine and the air that exerts pressure on the structure. While aerodynamic damping significantly contributes to the overall damping of an OWT in operational conditions, it becomes almost negligible during rotor-stop conditions. Researchers have noted that aerodynamic damping can range from 4% to 8% in the for-aft direction and from 0.08% to 1.43% in the side-side direction (Chen and Duffour, 2018). Various factors, such as wind speed, rotation speed, pitch angle of blades, and yaw angle of the rotor, influence the level of aerodynamic damping.
Hydrodynamic damping in OWTs has two primary sources: water wave radiation and hydrodynamic drag (Chan et al., 2015). The hydrodynamic drag is proportional to the velocity of the structure and is almost negligible due to the low velocity. On the other hand, wave radiation is a function of the relative velocity and has a more significant impact. Reported values for hydrodynamic damping in offshore wind turbines vary widely in the literature, ranging from 0.07% to 0.23%.
Structural damping pertains to the dissipation of energy during the vibration of the structure. This dissipation is a result of internal friction within the material of the structure, leading to the conversion of energy into heat. When estimating the structural damping in OWTs, it is common practice to rely on the damping values specified in standards for steel structures. For instance, both Damgaard and Andersen (2012) and Bisoi and Haldar (2014) reported structural damping of 0.19% for OWTs, a figure also referenced in the Eurocode (BS EN 1991-1-4, 2005). Arany et al. (2016) suggested values ranging from 0.15% to 1.5%. Shirzadeh et al. (2013) reported values in the range of 0.5%–1.5%, where the lower values are typically associated with pure material damping, and the higher values are attributed to structures with additional damping sources, such as joints.
When discussing structural damping, one must also address supplementary damping. Reducing the dynamic responses of OWT structures is crucial due to the significant role fatigue plays in their design. One approach is to apply structural control techniques commonly employed in skyscrapers and bridges. Tuned mass dampers are typically utilised in OWTs to minimise loads and vibration amplitudes. Tower oscillation dampers, also known as tuned mass dampers, are integrated systems within OWTs that aim to decrease vibration amplitudes. As discussed in Malekjafarian et al. (2021) these systems typically introduce a substantial level of damping to OWTs. An example of introducing damping to a specific OWT is demonstrated by Damgaard and Andersen (2012). Their system implementation incorporated a damping value of 1.36% into the OWT.
Soil damping originates is regarded as the second most substantial contributor to the overall damping of OWTs, following aerodynamic damping. Nonetheless, when the turbine is stationary or when assessing its lateral behaviour, the contribution of aerodynamic damping becomes almost negligible, while foundation damping emerges as the predominant factor Shirzadeh et al. (2013). The absence of a comprehensive methodology in existing design guidelines has resulted in the oversight of foundation damping in the design phase of OWTs (Carswell, 2015). Although foundation damping has historically received the least attention and exhibits the largest discrepancy between measured and theoretical results (Windenergie, 2005), there has been significant effort in recent years to address this issue. Yet, much of the recent research relies on back-calculating the foundation damping from observed tower damping, taking into account all other damping contributors. For instance, Carswell et al. (2015) underscored the importance of a comprehensive examination of different damping sources, such as aerodynamic, hydrodynamic, structural, and soil damping, in OWTs due to the close proximity of wind and wave load frequencies to their natural frequency. By proposing a method to convert hysteretic energy loss into a viscous, rotational mudline dashpot, they were able to demonstrate a considerable impact on the maximum mudline moment, with a reduction of 7–9%. This highlights the importance of incorporating foundation damping in OWT design for improved economics and load management.
A detailed examination of soil damping reveals that the vibrational energy around the monopile foundation can be dispersed through three primary routes: (1) Radiation damping, which arises when the pile's motion sends waves coursing through the soil, leading to energy dissipation; (2) Viscous damping, pertinent mainly when considering that seabed soils are often saturated, stemming from the migration of pore water amongst soil particles; and (3) Hysteretic material damping, which is due to material inherent internal friction when subjected to cyclic loading or deformation.
3.2.3.1. Soil radiation damping
Radiation damping, also called geometrical or external damping, arises due to energy dissipation caused by elastic waves spreading throughout the soil volume surrounding the monopile. Gazetas and Dobry (1984) presented a simple radiation damping model for piles and footings. The model was based on energy dissipation due to the propagation of elastic waves away from the foundation and has been validated against experimental data from laboratory tests and field measurements. This research presents a simple yet effective approach to estimate the damping of pile and footing foundations, which can be beneficial in the design and analysis of OWT foundations and other similar structures. The significance of the wave phenomenon depends on the frequency (ω) of the external excitation. To assess this significance, the non-dimensional parameter a0 = ωD/Vs is used, which compares the order of magnitude of the pile lateral velocity and the shear wave velocity of the soil stratum (Vs) subject to frequency of the external excitation (ω) for a give pile diameter of (D). Typically, the shear wave velocity varies between 150 m/s and 300 m/s depending on the soil type. In the case of an OWT supported by a monopile, the forces acting on the soil generally exhibit a low frequency, typically around the first natural frequency of the wind turbine system (≤1 Hz). Under such conditions, a0 is expected to be on the order of 10−2, indicating that the soil behaviour is predominantly quasi-static. As a result, radiation damping for a monopile-supported OWT can be safely disregarded (Juang and Pappa, 1985).
3.2.3.2. Soil pore water dissipation (seepage) damping
Damping arising from pore water seepage between soil particles is regarded as viscous and directly proportional to velocity and frequency. The significance of seepage damping is closely tied to the drainage conditions encircling a monopile. In soils with fine grains and low permeability, like clays, the behaviour is predominantly undrained, exhibiting negligible volumetric strain. This is because the time between load cycles does not allow for adequate dissipation of excess pore-water pressures, eliminating the possibility of viscous damping. In contrast, for coarse-grained, permeable soils such as sands or silty sands, the environment around a monopile can exhibit a range of behaviours from fully drained to partially drained or completely undrained. This behaviour is contingent upon factors like the loading speed, soil drainage characteristics, and drainage length. Numerous researchers (Bayat et al., 2016; Corciulo et al., 2017) have made efforts to develop models for quantifying this effect, but there is no universally accepted model that accurately encompasses both the stress-strain behaviour and drainage response of monopiles. While drainage conditions bear significance for substantial loads, they may have an insignificant impact on typical monopile loads (Li et al., 2019). Pore pressure dissipation is not anticipated to yield substantial damping in monopiles, making only minor contributions in highly permeable soils (Beuckelaers, 2015). Consequently, the primary contributor to monopile foundation damping remains the damping inherent to the soil material itself.
3.2.3.3. Soil hysteresis damping
Soil hysteresis (material) damping refers to the dissipation of energy within a soil mass caused by internal friction, sliding between particles, and structural rearrangement (Bratosin et al., 2002). According to Zhang et al. (2005), the primary factors influencing soil material damping include inter-particle friction, the strain rate variations, and the nonlinear response of soil. The connection between soil hysteresis damping and pore water pressures can be intricate, primarily because of alterations in the effective stress within the soil. The movement of pore water can result in viscous damping, while variations in excess pore water pressure can influence the effective stress of the soil, thereby impacting its material damping. O'Reilly and Brown (1991) proposes that not all time-dependent stress-strain reactions observed in actual soils are solely a result of viscous effects. Instead, certain time-dependent characteristics of soils can be explained by employing an inviscid constitutive model that emphasises the influence of effective stresses on soil behaviour. However, some studies have shown that soil material damping for monopiles is generally insensitive to frequency (Damgaard et al., 2013) or rate of loading (Beuckelaers, 2017) it is highly dependent on the soil strain, ε.
Geotechnical engineers typically use an equivalent damping ratio, D, to characterise energy dissipation in soils. During a cycle of loading, the energy dissipated (ΔW) can be calculated as the difference between the maximum strain energy stored (W) and the area under the unloading curve (Fig. 14). If the loading stress-strain curve is purely elastic, the material damping ratio is zero. However, Zhang et al. (2005) suggested that there is always some energy dissipation, even at very low strain levels, that should behave linear-elastically. This energy dissipation at low strain levels is referred to as the small strain damping ratio (Dmin), which is a constant value. As the strain level increases, the non-linear hysteretic behaviour of the soil leads to an increase in the material damping ratio.
 Fig. 14
Similar to many other researchers, Damgaard and Andersen (2012) used full-scale testing of OWTs to identify their crosswind modal properties. Based on back-calculating the foundation damping from measured tower damping, 1% of soil damping in non-operating conditions was estimated. It was noted that modal properties, including natural frequencies, damping ratios, and mode shapes, are affected by a wide range of factors, such as turbine geometry, wind speed, turbulence intensity, and the stiffness and damping of the foundation.
Jindal et al. (2024a) used model testing to measure soil damping, isolating it from other sources. The tests analysed three monopile sizes with slenderness ratios from 3.75 to 10 under 5–10% ULS loading. The authors introduced a zonal method to represent measured soil damping along the pile length, aiming to reduce design complexities. In Jindal et al., 2024b, a detailed comparison of the impact of pile slenderness ratio, cyclic loading amplitude, forcing frequency, and number of cycles on soil material damping is presented. The damping profile observed along the entire length of all test piles showed a non-linear and fluctuating shape, deviating from the typically assumed linear profile in industry practices. In general, soil damping increased from the mudline to the peak soil damping region (approx. from 0.1L to 0.2L), where L is the embedded length, then decreased towards the minimum soil damping region (approx. from 0.45L to 0.7L) followed by moderate increase towards the pile toe depending on the slenderness on the pile.
It is evident that many values in the literature are frequently derived or back-calculated from the comprehensive damping values of monopiles. This underscores the pressing need to augment the existing literature on damping in monopile foundations by conducting systematic scaled model tests and element tests for direct estimation of soil damping. Measuring soil damping by utilisation element tests can be achieved by state-of-the-art testing apparatus, including the resonant column, torsional shear, cyclic triaxial, or cyclic direct simple shear equipment. Previous research in the field of soil material damping has predominantly centred on investigating the seismic response of soils. It has been established that the soil damping ratio (D) can be correlated with the degradation of shear modulus as shear strain increases. In cases where specific laboratory tests for determining soil shear modulus degradation or damping curves tailored to a particular site are lacking, databases containing soil laboratory test results can serve to reasonably estimate the range of soil material damping ratio for a given soil element as a function of shear strain within a specific material type. It is worth noting that while most laboratory tests focus on the relationship between soil damping ratio and shear strain, volumetric strain can also contribute to energy dissipation. This is due to the tendency of soils to undergo volume changes during shearing, and extended cyclic loading may lead to irreversible plastic volume alterations, such as densification, which contribute to the overall soil material damping. However, this effect is expected to be small compared to the damping due to plastic shear strains.
It is crucial to note that test results from element tests conducted in a laboratory environment must be validated and correlated with small/full-scale monopile measurements.
3.3. Computer models and simulations
Recent advancements in numerical modelling for monopile foundations in OWTs have significantly enhanced understanding of soil-structure interactions under cyclic and monotonic loading conditions. These improvements are characterised by sophisticated finite element (FE) models that incorporate advanced constitutive models to effectively simulate soil behaviour. The interaction between monopiles and soil is critically understood through both implicit and explicit models. Implicit models offer detailed simulations by tracking the entire stress-strain response, while explicit models streamline the process by using predetermined cyclic loading cycles to predict long-term effects. This simplification helps manage the complexity of irregular, multi-directional loads but may not fully capture the actual soil response under real storm conditions (Liu et al., 2022a, Liu et al., 2022b). Investigated the effects of load history idealisation on the design of monopiles in clay, main focus was the characteristic behaviour of clay under cyclic loading to optimise monopile design for OWTs. The research employs a series of load-controlled cyclic triaxial tests to assess the impact of different load representations on soil behaviour. These tests demonstrated that irregular load histories often lead to larger accumulated shear strains and greater soil degradation compared to idealised regular load histories. The study highlights the importance of idealising irregular environmental loads into regular cyclic loading packages with uniform amplitudes, arranged in ascending order, to manage the complexity of real-world loading conditions while maintaining prediction accuracy. Experimental cyclic triaxial tests on normally consolidated reconstituted clay specimens simulate 1-h storm loading on a monopile foundation in the North Sea, revealing that the sequence and amplitude of load cycles significantly impact the soil's strain accumulation and pore water pressure. Irregular loading history generates the largest accumulated shear strain, leading to significant soil degradation, while idealised loading histories with ascending amplitude cycles accumulate less strain and are less conservative in predicting soil behaviour.
Irregular loading, including post-storm performance of offshore wind turbines raises two critical concerns: first, soil degradation alters the natural frequency of the soil-structure system, potentially causing resonances and excessive tilting of the wind turbine; second, degraded soil is more susceptible to large permanent deformations, which can impair the optimal energy output of the turbine. Therefore, it is essential to understand the impact of post-storm soil stiffness degradation on the performance of offshore wind turbines. Various recent studies, including Liu et al., 2022a, Liu et al., 2022b, have demonstrated that irregular loading leads to significant soil degradation, which impacts the performance of monopiles.
Zha et al. (2022) introduced a simplified model for predicting accumulated displacement of monopiles under horizontal cyclic loading, which is critical for offshore wind turbines. The model incorporates pile diameter, number of cycles, loading profile, and undrained shear strength profile to address the challenges of predicting displacement over a turbine's 25–30 year lifetime. Validated using the hyperplastic accelerated ratcheting model and a 3D FE approach, it simulates soil-pile interactions effectively. Experimental validation through cyclic triaxial and centrifuge tests highlights that storm events contribute more to displacement than long-term cyclic loadings, and final displacement is independent of load sequence. This comprehensive method enhances the reliability and safety of monopile designs by providing more accurate displacement predictions.
The study by Lopes et al. (2023) presents a numerical methodology to predict the lateral load response of monopiles installed in sand, considering soil stiffness degradation. The authors developed a 3D finite element model incorporating the Mohr-Coulomb criterion and various soil stiffness degradation models, such as those proposed by (Menq, 2003; Behzad Amir-Faryar and McCuen, 2017; Oztoprak and Bolton, 2013). These curves were validated against experimental results from centrifuge modelling, showing good agreement, especially for small displacement conditions. The study highlighted the critical role of soil stiffness degradation in the design of monopiles, demonstrating that neglecting this factor could lead to underestimations of monopile displacements and lateral load capacities.
The study by Jiang et al. (2024) investigates the soil deformation characteristics around monopile foundations under cyclic horizontal loading using Particle Image Velocimetry (PIV) technology. The study combines a model test system with PIV to examine the deformation and stiffness degradation of soil around piles under wave loading. Key findings include the identification of three distinct stages in the cumulative displacement of pile tops under cyclic loading: linear growth, sluggish growth, and stable deformation. The study shows that soil in the passive zone around the pile forms a wedge-shaped deformation pattern, while soil in the active zone exhibits significant differences under various loading conditions. The stiffness degradation model developed in the study correlates well with experimental results, providing a reliable method for evaluating the stiffness degradation of soil under cyclic loading. The research highlights the importance of considering soil stiffness degradation in the design of monopile foundations. The cyclic loading causes the soil around the pile to compact and rearrange, leading to changes in its stiffness and, consequently, the overall stability and performance of the monopile foundation.
Sun et al. (2023) examines the cumulative cyclic response of offshore monopiles in sands under lateral cyclic loading. The researchers developed a numerical model using the FLAC3D finite difference platform, incorporating the SANISAND soil constitutive model to simulate the sand's dilatancy and saturated seabed sand behaviour. This model was validated against triaxial and centrifuge tests, demonstrating good agreement in predicting initial stiffness, peak deviatoric stress, and excess pore pressure development in saturated sand. The study focuses on evaluating the cumulative deformation of large-diameter monopiles installed in saturated sand compared to dry sand. It highlights that the accumulation and dissipation of transient excess pore pressure in saturated sand significantly increase the cumulative deformation of monopiles. Key parameters such as soil relative density, pile diameter, cyclic loading amplitude, and frequency were analysed to understand their impact on the cumulative deformation. The findings revealed that larger subsidence and reduced soil capacity around the pile in saturated sand lead to greater cumulative deformation compared to dry sand. The study developed an analytical model to calculate the cumulative pile-top displacement under lateral cyclic loading, considering the effects of pile diameter and soil conditions. This model was validated against centrifuge tests and model pile tests, showing good predictive capability for the cumulative displacement of monopiles in saturated conditions. Overall, the research underscores the importance of considering transient excess pore pressure and soil saturation in the design and analysis of offshore monopiles to ensure their long-term performance and stability under cyclic loading conditions.
Saathoff and Achmus (2024) address the issue of bearing capacity reduction in sandy soils due to pore pressure accumulation from cyclic loads. They developed an explicit computational model using three-dimensional FE analyses with C3D8(P) elements to capture stress distribution and deformation of monopiles under various loading conditions. The study employed cyclic direct simple shear (DSS) tests to derive contour plots and equations describing excess pore pressure accumulation, highlighting the relationship between cyclic stress ratios, mean stress ratios, and soil response. This research underscores the need for practical numerical methods to estimate capacity degradation due to pore pressure accumulation, especially during storm events. Experimental cyclic triaxial and DSS tests validated these models, ensuring accurate reflection of soil behaviour under cyclic loading, thus enabling more reliable and efficient design of offshore monopile foundations.
The study by Chaloulos et al. (2024) explores the response of monopile foundations for offshore wind turbines (OWTs) in dense sand under cyclic loading conditions. Utilising a three-dimensional coupled cyclic time-history numerical analysis, the research focuses on the effects of drainage conditions on the performance of monopiles. The analyses were performed using the Ta-Ger constitutive model within the FLAC3D software, which accurately represents complex soil behaviours under cyclic loading, including pore pressure generation and dissipation. Experimental validation was achieved through comparisons with centrifuge tests on saturated dense Toyoura sand, demonstrating good agreement between the numerical and experimental results. This validation confirms that the calibrated numerical model can capture the key mechanisms influencing monopile response under cyclic loading conditions.
The literature pool was also expanded by the Discrete Element Method (DEM) to analyse the underlying mechanisms of cyclic responses of soils. DEM provides detailed insights into micro-scale particle interactions and their effects on soil behaviour under cyclic loading. For instance, Cui et al. (2023) used DEM to study the cyclic behaviour of granular soils, focusing on particle rearrangements and structural changes. Zhu et al. (2021) applied DEM to investigate the cyclic shear behaviour of sandy soils, highlighting particle breakage and contact network evolution.
Overall, the studies conclude that the conventional load history idealisation in monopile design might underestimate soil degradation if significant average shear stress is present. Hence, there is a need for further experimental and numerical investigations to develop improved procedures for monopile design under irregular loading conditions.
4. Design methodologies and research contributions for monotonic loading
The preceding section highlighted the critical pain points within the industry from a geotechnical perspective. In recent years, various attempts have been made to address these concerns leading to the development of new design guidelines. Consequently, this section aims to provide an review of some of the notable research efforts undertaken in this area and an analysis of the current state-of-the-art in geotechnical design specifically focused on monotonic response of monopile foundations for OWTs.
4.1. PISA design methodology
The PISA (Pile-Soil Analysis) joint industry project represented a comprehensive initiative that combined field testing, numerical modelling and the development of a new design methodology for the design of piles under monotonic loading conditions. The research encompassed a range of interconnected activities, which included.
-
•
Reduced-scale field testing of monopiles at two distinct representative sites: an over-consolidated clay till site in Cowden, United Kingdom, and a dense sand site in Dunkirk, France.
-
•
The development of three-dimensional finite-element models to accurately simulate and represent the performance characteristics exhibited by each of the monopiles subjected to testing.
-
•
The creation of a novel approach for monopile design, referred to as the ‘PISA design model.’ This design model was built upon an improved version of the p-ymethod, offering enhanced capabilities for designing monopiles under various loading conditions.
The historical development of the p-y method, which serves as the foundation for many design guidelines, involved determining p-y curves directly from field measurements conducted on a set of test piles. However, this experimental approach was not feasible in the PISA project for several principal reasons. Firstly, the field testing in the PISA study utilised reduced-scale monopiles, raising uncertainties about the reliable extrapolation of data to full-scale conditions. Secondly, it was impractical to design instrumentation systems capable of accurately measuring all distinct soil reaction components required by the model. Lastly, the appropriate soil reaction curves for a specific design scenario could potentially depend on site-specific factors such as variations in strength with depth and soil layering. Investigating all these variations through field testing would have been impractical. Instead, the PISA project employed an alternative approach to calibrate the design model, as illustrated in Fig. 15.
 Fig. 15
Advanced three-dimensional finite-element models were developed to enhance the understanding of pile behaviour at sandy and clayey sites. Notably, these FE analyses were conducted before the field tests, aiding in the design of the testing program and, subsequently, validating the accuracy of the finite-element models. This validation process involved comparing the FE model predictions with the data obtained from the field tests. Once the three-dimensional finite-element models were deemed acceptable in replicating the field test outcomes, separate calibration analyses were undertaken. These calibration analyses extended the range of considered parameters, encompassing variations in soil properties, pile characteristics, and loading conditions. The objective of these analyses was to identify suitable forms of soil reaction curves that could be integrated into the PISA 1D design model.
4.1.1. Reduced-scale field testing
As part of the PISA project, a field-testing campaign was conducted to investigate the response of monopile foundations primarily under monotonic (Byrne et al., 2020; McAdam et al., 2020; Zdravković et al., 2020c). The tests were designed to represent, albeit at a reduced scale, the typical design conditions for monopile foundations used in offshore wind turbines in the North Sea. Two onshore sites, namely Cowden in the United Kingdom, with an over-consolidated clay till site and Dunkirk in France, with a dense to medium-dense sand site, were selected for the tests. The test piles were instrumented with inclinometers, strain gauges, displacement transducers, and a load cell, enabling the measurement and monitoring of pile behaviour during the tests. The selected pile length-to-diameter ratio (L/D) ratio ranged from approximately 3 to 10, which aligns with typical values used for offshore wind turbine foundations. Three different pile diameters were chosen: small (D = 0.273 m), medium (D = 0.762 m), and large (D = 2.0 m). At each test site, a total of 14 steel, open-ended test piles were installed. A standard minimum spacing of 10 times the pile diameter (10D) was adopted to minimise any potential pile-to-pile interaction effects. The load eccentricity was set at 5 m for small-diameter piles and 10 m for the remaining piles. It was considered essential to apply the load above ground, replicating the realistic horizontal force and moment loading experienced by offshore monopiles. The reader is referred to Burd et al. (2020)for further details regarding the test setup and data processing.
4.1.1.1. Cowden stiff glacial clay till
The field test results in stiff glacial clay till by Byrne et al. (2020b) presented empirical data and analyses on the behaviour of monopile foundations subjected to monotonic lateral loads. The findings demonstrated a good level of repeatability in the test results, supporting the use of field data for comparison with separate three-dimensional finite-element studies. The study provided insights into the load-deflection response of piles with different diameters and length-to-diameter ratios. The site tests also highlighted the potential enhanced performance of monopiles in clay at higher rates of loading, suggesting the presence of unaccounted strength reserves that are not considered in current design approaches. Although the results were insufficient to quantitatively assess the effects of loading rate for incorporation into design methods, it was evident that monopile foundations designed based on the strength of the ground under slow loading conditions may possess significant reserves of strength in scenarios such as storm waves or ship impacts, where substantial loads are applied for a short duration., During the pile tests, it was consistently observed that a gap formed on the active face of the pile, and occasionally on the passive face following unloading. Typically, a significant gap was observed, approximately half the embedded depth of the pile. The formation of a gap is considered a crucial aspect of monopile behaviour as it can significantly influence the pile response. When there is a lack of contact between the pile and the soil over a substantial portion of its surface area, the pile stiffness is reduced, which may impact the overall dynamics of the pile/tower system. It is important to note that the gaps reported occurred after applying loads that greatly exceeded the anticipated in-service conditions for a prototype foundation. Therefore, the tendency for gaps to form around a monopile under normal working loads is expected to be considerably less pronounced than the data indicates. For piles with a higher slenderness ratio (L/D = 10), the deflection mode transitioned from flexural to a combination of flexural and rotational as the load increased, with an increasing depth of the pivot point and peak bending moment. In contrast, piles with a lower slenderness ratio (L/D = 3) exhibited rigid rotational deflection with a constant pivot depth and an increasing bending moment along the entire embedded length. For the intermediate slenderness ratio (L/D = 5.25), the behaviour evolved from initially flexible to a rigid rotational mode with a toe kick as the load increases, reaching a final pivot depth of approximately 0.7 times the pile diameter. This behaviour was consistent with centrifuge tests on monopiles in clay by Haiderali et al. (2015) and demonstrates the influence of the L/D ratio on the depth of the pivot point and the overall response of the pile under lateral loading conditions.
4.1.1.2. Dunkirk marine sand
The findings from test run in dense marine sand (McAdam et al., 2020) were broadly consistent with the related Cowden study described above (Byrne et al., 2020). The study presented data on the load-deflection response of piles with different diameters and length-to-diameter ratios, demonstrating a high level of repeatability and supporting the use of the data for verifying three-dimensional finite-element models. Softening behaviour of soil was observed in certain short, medium-diameter piles (D = 0·762 m, L/D = 3), while strength and stiffness metrics were found to increase with the increasing length for medium-diameter piles, in line with expectations. It is noted that softening behaviour was not observed for any of the complementary tests conducted at the Cowden clay site. The tests conducted at different velocities indicated a potential strength enhancement at higher loading rates suggesting the existence of strength reserves not currently considered in design approaches. Time-dependent effects due to creep were evident in the monotonic loading tests. The study also highlighted the influence of assumed pore pressure suctions on gap formation and unload-reload behaviour around the pile. However, the influence of loading rate was less strong in sand at Dunkirk than in the complementary tests at the clay site in Cowden. Similar to the pile tests conducted in clay, the presence of a gap was observed on the active face of all test piles in a comparable manner. It is also worth mentioning that, following unloading, gaps were often observed on the passive face as well. It is important to be aware that the unsaturated nature of the superficial layers at the Dunkirk site may limit the applicability of the observed gap formation to offshore conditions. Whereas offshore soil conditions are typically saturated, and as such, the gap formation observed in the tests may not be representative of actual offshore scenarios. Overall, the results suggest that as the L/D ratio decreases, the pile behaviour transitions from flexural to rotational deflection modes. The depth of the pivot point and peak bending moment generally increases with increasing load. For piles with L/D = 8, a transition from flexural to combined flexural and rotational deflection was observed, with an increase in the depth of the pivot point and peak bending moment as the load increased. Piles with L/D = 3 exhibited rigid rotational deflection, while larger-diameter piles with L/D = 5.25 showed an initially flexible deflected shape that transitioned to rigid rotational deflection.
Both field test outcomes from sandy and clay soils contributed to the empirical database for validating finite element analyses and the development of a new 1D modelling procedure, known as the PISA design model, for offshore monopile design.
4.1.2. Finite element studies
4.1.2.1. Cowden stiff glacial clay till
As part of the PISA project, prior to reduced-scale site tests Zdravković et al. (2020c), introduced a three-dimensional finite-element analyses to predict the behaviour of Cowden clay medium-scale pile tests using Imperial College Finite Element Program (ICFEP) by Potts and Zdravkovic (1999). During these analyses, a particular focus was on ensuring consistent interpretation of the soil data obtained from field and laboratory information as discussed by Zdravković et al. (2020a). This included the determination of soil shear strength at the intermediate Lode's angle, calibration of the parameters controlling the shape of the non-linear Hvorslev surface, tangent shear modulus, non-linear elastic shear and bulk moduli. An enhanced version of the modified Cam Clay model (Roscoe and Burland, 1968) was employed for the numerical simulations, which was enhanced with (a) a non-linear Hvorslev-type surface (Tsiampousi et al., 2013) was incorporated to accurately capture the undrained strength of Cowden until it was dry and critical; (b) a generalised shape for the yield and plastic potential surfaces in the deviatoric plane (Van Eekelen, 1980) was used to account for the effect of the intermediate principal stress, as observed in the different strengths of Cowden till during triaxial compression and extension; (c) a modified hyperbolic equation was employed to simulate the non-linear variation of the elastic shear modulus with mean effective stress and deformation level (Taborda and Zdravkovic, 2012). Considering the cruciality of the pile-soil interface to simulate the opening of a gap around the pile, the outer pile-soil interface was discretised using 16-noded zero-thickness interface elements (Day and Potts, 1994). The behaviour of these elements was represented by an elasto-plastic Tresca model with limited tensile capacity (assumed to be zero in the study). The interface shear strength in compression adopted the initial undrained shear strength of the adjacent soil element, seamlessly reflecting the contributions of spatial variations in stress conditions, over-consolidation ratio and loading direction. Due to the low permeability of Cowden till, the numerical analyses were conducted under undrained conditions. This undrained state was achieved by specifying that the bulk modulus of the pore fluid was three orders of magnitude larger than that of the soil. For further details on this procedure, the reader can refer to Zdravković et al. (2020b).
The influence of the geometric characteristics of the monopile on its response is illustrated in Fig. 16, where the normalised deformed shapes of two piles are shown as an example. These two piles represent the extreme values of the length-to-diameter ratio (L/D) and were chosen to demonstrate the impact of this ratio on their behaviour. While both CM2 and CM3 piles have the same diameter, their lengths differ significantly, with L/D values of 3.0 and 10.0, respectively. Consequently, CM2 exhibited a rigid-body rotation around a point located approximately 70% of the pile length, while the response of CM3 was considerably more flexible. The figure also displays the maximum depths of the gaps formed around these two piles due to the applied loading, which varied considerably around the pile circumference, with the maximum occurring in the plane of symmetry on the active side of the pile. Notably, the rigid-body rotation of CM2 results in the formation of a deeper gap in normalised terms (LG/L = 0.67) compared to pile CM3 (LG/L = 0.53), where LG represents the depth of the gap. It's worth mentioning that the significant gap extents determined from the numerical model closely aligns with the observed field behaviour reported in the work by (Byrne et al., 2020a). Overall, the FE model developed was proved to predict accurately the response to lateral loading of four distinct PISA test piles installed at Cowden. A good agreement between the predicted and measured responses of these four piles validated the fundamental premise of the PISA project. The study evaluated the accuracy of the developed numerical model in predicting pile behaviour using two distinct metrics which yielded an average accuracy of 88% for large and 85% for small ground-level displacement. The model demonstrated consistent high accuracy across different pile geometries and slenderness ratios installed at Cowden till.
 Fig. 16
4.1.2.2. Dunkirk marine sand
Presented by Taborda et al. (2020a), the behaviour of Dunkirk sand was modelled using the parameter-based bounding surface plasticity model, as detailed by Taborda and Zdravkovic (2012). This model was a progression from Manzari and Dafalias (1997) and was selected based on the insights from the Dunkirk ground model assessment by Burd et al. (2019a). The latter emphasised the relevance of the critical state framework for delineating the mechanical characteristics of dense, quartsitic, marine sand. More importantly, the pivotal requirement for selecting this model was its ability to mirror the influence of void ratio and mean effective stress on sand behaviour with a consistent set of calibrated parameters. For a deeper insight into the model structure, deployment, and calibration, the reader may consult Taborda and Zdravkovic (2012). In essence, the model employs four distinct surfaces to describe the mechanical response of sands: (1) yield surface, which serves as the boundary of the elastic region; (2) critical state surface, defining the stress conditions at which failure occurs; (3) dilatancy surface, marking the transition from plastic contraction to plastic dilation; and (4) bounding surface, which controls the sand peak strength and the plastic strain rate. Regarding elastic behaviour, the model incorporated a non-linear elastic stiffness degradation based on Ramberg and Osgood (1943), which replicated hysteresis in the soil response within the elastic region, contributing to energy dissipation. The bounding surface plasticity model for Dunkirk sand was calibrated using a hierarchical approach, referencing methodologies from Loukidis and Salgado (2009) and Taborda (2011). The calibration concentrated on parameters determining the strength, critical state, and stiffness of the sand. Zdravković et al. (2020b) summarised the experimental data used for this calibration. The calibration process for the model yielded two parameter sets: (1) based on lab data and (2) from field tests. When comparing the initial state parameter from the ground characterisation to laboratory tests, discrepancies were observed. Given these inconsistencies and challenges in triaxial testing, special attention was given to establishing a numerical model. Special interface elements were introduced around the pile exterior to accurately model the interaction between the pile and soil. These zero-thickness elements were designed to account for potential separation between the pile and soil which utilised an elasto-plastic Mohr–Coulomb model for behaviour characterisation.
The analysed test piles predominantly showed rigid-body rotation deformation. This behaviour was better understood by examining the changes in mean effective stress and resulting void ratio in the soil around the pile. As the pile was loaded, the mean effective stress increased in certain areas, while other areas experienced reduced stress, leading to increased void ratios and sand loosening. This highlighted the significance of using a sand model that can capture soil changes due to variations in void ratio and stress levels. Additionally, the soil state around the pile varied from triaxial compression to triaxial extension, influenced by initial suction in the interface elements. It was emphasised that soil gapping, resulting from superficial suctions, was not relevant for offshore environments since the seabed soil had always been fully saturated. The three-dimensional finite-element analyses were compared with field testing results in terms of load-displacement for four test piles. The finite-element predictions largely aligned with the field results, except for the shortest pile. The FE analyses achieved an average accuracy of 81% for the ultimate response and 72% for small displacements.
4.1.3. 1D design method
The PISA design methodology Burd et al. (2019b) draws on the traditional p–yapproach but extends it to include additional soil reaction components that have been identified as significant for piles with relatively low values of L/D (Byrne et al., 2020; Schroeder et al., 2015). This enhancement allows for more accurate performance. The model calibration employs a series of three-dimensional finite-element analyses, leveraging the potential realism offered by finite-element modelling. The final output – ‘soil reaction curves' a term used in the model to describe the functions used to associate soil reactions with local pile displacements (and rotations).
The PISA design model gives a one-dimensional portrayal of a monopile foundation (referred as 1D numerical model) subjected to lateral loads, Fig. 17. This format is consistent with the standard p–y method, where a distributed lateral load is applied to the pile. In addition, it also accounts for a distributed moment due to vertical tractions at the soil-pile interface, as well as a lateral force and moment at the base of the pile. The model represents the monopile as an embedded beam and includes four components of soil reaction following previous work by DiGioia et al. (1983) for the design of drilled shafts, principally for onshore applications. These four key components for the soil reaction, which occur at the soil-pile interface are: (a) distributed lateral loads; (b) vertical shear tractions; (c) horizontal force at the pile base; and (d) moment at the pile base. It assumes that vertical loads have negligible impact on the monopile hence the vertical shear tractions were considered to arise only due to local rotation of the pile cross-section performance. The model employs Timoshenko beam theory, which allows for the inclusion of shear strains in the pile in the analysis. The pile is depicted using a linear mesh of two-noded Timoshenko beam elements. The model hired shell element formulation for thin-walled approximation to specify structural properties. Soil finite-elements, sharing the same displacement and rotation interpolation functions as the beam elements, were connected to the beam elements along the embedded length of the pile. The Galerkin method was used to create a set of equations based on assumed approximations of displacements within the system. Virtual work statement was used to solve equilibrium problems. The model adopts four Gauss points per element for both beam and soil elements to compute stiffness matrices and internal force vectors.
 Fig. 17
1D numerical model utilises soil reaction curves based on dimensionless forms of relevant soil reaction and displacement/rotation variables. These dimensionless parameters explicitly consider ‘diameter effect’ which has been a missing part of various industry code of practices. This approach enables the development of standard forms which can be scaled to represent soil reactions on the pile at any depth. The local values of initial vertical effective stress in the soil, soil small-strain shear modulus, local pile lateral displacement, and cross-section rotation were considered.
Three-dimensional finite-element models were developed in lieu of previous project practice (Taborda et al., 2020b; Zdravković et al., 2020b) which provided groundwork for the calibration calculations of 1D numerical models. Therefore, despite the indirect connection, the PISA design model calibration process maintained a link with the performance observations of the PISA test piles at Cowden and Dunkirk. Soil reaction curves (referred to as ‘numerical soil reaction curves’) were extracted from three-dimensional finite-element results. Once normalised with dimensionless groups representing various soil and pile interaction parameters, the numerical soil reaction curves were incorporated into 1D numerical model at Gauss points, subsequently, to assess the robustness of 1D numerical model. Comparison of 1D numerical model and three-dimensional finite-element models was assessed using accuracy metrics. Metrics have been calculated for both ultimate displacements and small displacements for a range of piles at different relative densities. For sandy soil, a relative density of 75%, the accuracy metrics ranged from 0.92 to 0.98 for ultimate displacements and from 0.89 to 0.98 for small displacements, whereas for clays 0·90 to 0·99 and 0·95 to 0·99 were observed, respectively. Hence, a close agreement was found for other relative density cases as well, affirming the reliability of the 1D numerical model in comparison to the 3D calibration data.
While the 1D numerical model effectively replicated the three-dimensional calibration data, it lacked predictive ability. Therefore, by creating and calibrating general analytical expressions for the soil reaction curves, a version of the 1D model, termed as ‘1D parametric model’ was formulated. The development of the 1D parametric model required various levels of calibration. Parameters for fitting the soil reaction curves are identified through a two-phase approach. Initially, a first-stage calibration was performed based on the numerical soil reaction curves determined from the three-dimensional finite-element calibration analyses. These parameters were assumed to change with depth, following functions known as ‘depth variation functions'. Subsequently, a second-stage optimisation process was undertaken, wherein minor adjustments are made to the depth variation parameters to enhance the alignment between the 1D parametric model and the calibration data for the pile head performance. Performance metrics for the application of the 1D parametric models to the full range of calibration piles yielded an excellent agreement of the model to the data.
In summary, the PISA methodology has been developed as a one-dimensional analysis model for monopile foundations, primarily for monotonic loading conditions. This methodology extends the traditional p-y approach used in geotechnical engineering. The PISA methodology provides a pragmatic way to extend the static p-y method, commonly used for monopile design. It represents the behaviour of monopiles under lateral loads, making certain assumptions and using empirical factors effectively. New mathematical functions representing the soil reaction curves have been developed to suit the 1D model. These functions are aimed to replace the conventional p-y curves effectively. It is believed it can potentially reduce design conservatism and lead to cost savings for wind farm development. Although the current modelling procedure is limited to monotonic loading conditions, it has the potential to be extended to model soil damping for dynamic analyses and cyclic loading scenarios.
4.2. New ISO/API design methodology
The new ISO methodology introduces a novel framework for calculating the best estimate p-y curves specifically tailored for clay soils. The updated approach supersedes the long-standing API Matlock p-y curves and is specified in ISO 19901-4 (2016) and API RP 2GEO (2021). The revised framework considers various loading conditions, including monotonic, cyclic, and fatigue loading, providing a comprehensive solution for geotechnical design in these scenarios (Philippe et al., 2022). The shape of the monotonic p-y curves and bearing capacity factors indicate that the new ISO p-y curves and PISA results from the Cowden site are in good agreement with each other.
The purpose of the work was to introduce a new framework for the calculation of best-estimate p-y curves for monotonic loading by (a) revisiting and harmonising chosen techniques for determining the lateral bearing capacity factor from outcomes of limit equilibrium analyses since 1950s, including findings from contemporary plastic limit analyses; (b) formulating a new scaling method to ascertain the form of the p-y curves based on the stress-strain curve acquired from a DSS database consisting of over 500 DSS tests. The suggested framework was subsequently applied to retrospectively evaluate the results of centrifuge tests and 1-g small and large-scale pile load tests in a spectrum of clays from very soft to hard.
4.2.1. Review of past research findings on ultimate pile capacity
The framework used for calculating the ultimate lateral pile capacity is divided into two parts. The division was based on the pile embedment depth below the ground surface and the corresponding soil failure mechanisms. It was observed that.
-
1
At some significant depth below the ground surface, the free surface no longer affects the soil failure mechanism. In this situation, the soil moves or “flows around the pile” without creating gaps, following a plane strain mechanism. This means the soil adjusts to the presence of the pile by moving aside in a continuous, non-separating manner.
-
2
At shallow depths near the free surface (ground surface), where it has an influence, the soil failure mechanism is different. Here, the soil fails in a wedge-like pattern. This means that, due to the presence and pressure of the pile, the soil breaks away in a defined, angular pattern, similar to a “wedge”.
Regarding the scenarios of resistance mobilisation around a pile, it is dependent on the formation of a gap on its active (or back) side.
-
a)
Gap forms on the active side of the pile, only the resistance from the passive wedge (the soil in front of the pile) is utilised. This resistance is due to the shear strength and weight of the passive wedge, which helps in bearing the load.
-
b)
No gap formation in which cases a gap does not form, and the soil is isotropic (has uniform properties in all directions), the resistances due to the shear strength of both active and passive wedges are equal and mobilised. However, the resistances due to the weight of the active and passive wedges counteract each other, essentially nullifying each other's impact. This scenario reflects a balance where the opposing resistances cancel each other out, leading to no contribution from the weight of the wedges to the overall resistance.
For visual representation, the reader is referred to Fig. 18.
 Fig. 18
 Fig. 19
Previous research investigations of both the flow-around failure mechanism (at significant depths) and the wedge failure mechanism (at shallow depths) were considered to determine the lateral bearing factors for ultimate values of p-ycurves at failure (see Fig. 19). For the flow-around mechanism, early evaluations primarily used limit equilibrium techniques, while plastic limit analyses were incorporated into later assessments. Whereas the wedge failure mechanism was studied using both aforementioned methods, supplemented with empirical correlations. In conclusion, for the flow-around lateral ultimate resistance factor, Matlock and Reese (1962) highlighted the influence of cavity development behind the pile due to soil volume change. This led to the recommendation of an ultimate resistance factor of 8–9. The recommendation of a tentative value of around 9 was further adopted by Broms (1964) and solidified within API standards since then for smooth piles. Whereas for wedge failing ultimate capacity factor, the conclusion on existing methods and API standards underscored the diversity in assumptions regarding pile roughness and gap presence in published methods. Specifically, the Matlock (1970)recommendations embedded in API standards convey varied implications for different conditions. A smooth pile for the flow-around mechanism, a fully rough pile for shallow wedge calculations were suggested. Integral values for calculation of lateral bearing factor also varied considerably.
Based on the findings from past research projects, and it introduces a refined framework for calculating the bearing capacity factor, built on prior work by Zhang and Andersen (2017) which was a modified version of bearing capacity factors initially proposed by Yu et al. (2015). This updated model was evaluated against existing methods, offering a more adaptable and reliable approach. The analysis concluded that the proposed framework aligns closely with established models, particularly under varying assumptions about gapping. The research underscores the proposed model's promise for enhancing accuracy in calculating bearing capacity factors across diverse conditions.
4.2.2. Dynamic simple shear tests and calibration of soil hardening rule
The proposed framework for calculating the bearing capacity factors discussed above determines only the ultimate value of the p-y curve at failure, employing limit equilibrium and plastic limit analyses. Both analyses assumed the rigid plastic behaviour of the soil, omitting details regarding the lateral displacement required to mobilise this ultimate value. To estimate p-y curves for practical use, a study was conducted into the correlation between the shapes of p-y curves and laboratory stress-strain curves. For this purpose, a compiled database of 537 DSS stress-strain curves has been assembled, originating from tests conducted on samples derived from five offshore regions. The stress-strain curves were fitted to establish a hardening rule for application with the von Mises plasticity model in finite-element analysis.
4.2.3. New p-y curves from parametric finite-element analyses
Following the new hardening rule, a series of finite-element analysis were run to simulate pile-soil interaction. Adaptive meshing tools were used in maintaining the accuracy of simulations amid the large deformations and nonlinear behaviour of clay. The Arbitrary Lagrangian-Eulerian analysis in Abaqus, only applied to soil elements, permitted the mesh to move independently of the material. The pile was modelled out of rigid elements. The undrained behaviour of clay was modelled with a high Poisson's ratio, indicating that the clay exhibits little volumetric change, i.e., it neither contracts nor expands significantly when subjected to a load. Linear quadrilateral-type elements were used for the entire model. The setup for the simulation involved a specific type of contact interaction where the outer elements of the pile and the inner elements of the soil were defined in a master-slave relationship. This arrangement ensures that the soil nodes would follow the motion of the pile nodes. Two different surface conditions, rough and smooth, were analysed to observe the variations in the simulation results under these different conditions while keeping the normal behaviour consistent as “hard”. The simulation of pile loading was conducted by moving the reference point in the direction where the counteracting force against this displacement was calculated to determine the p-y response. The employed plasticity model adhered to the Von Mises failure criterion. The elastic characteristics were defined by Young's modulus. For the plastic behaviour, a work hardening rule was applied, as detailed in sections above.
Based on the parametric finite-element analyses, 24 p-y curves were obtained while both elastic and plastic lateral displacement components were recorded. The elastic normalised displacement in a p-y curve was derived from the theoretical solution for lateral pile response in an elastic material, whereas for the plastic normalised displacement, an empirical fit is used. This fit was calculated as a function of the plastic strain at failure in a DSS test and the shape of the DSS curve, as represented by the model parameter proposed by the authors. The plastic p-y curves were then normalised and curve fitted to obtain an equation, which was further used to scale normalised DSS curves to obtain normalised p-y curves.
For the selection of shear strength, which involves multiple considerations, including the type of tests (tri-axial or DSS), the conditions (gapping or non-gapping), and inherent factors like anisotropy and rate effects, the researchers provided detailed guidance and recommendations for each scenario, including specific formulas and factors to use in calculations, with references to further detailed data and analysis for more comprehensive evaluation. In regards with ‘diameter effects’, it was concluded that the form of the normalised p-y curve is not reliant on diameter, however, the p-y curve at a specific depth for a particular soil profile does depend on the pile diameter within the depth of the wedge failure. The proposed method is thought to effectively encompass these ‘diameter effects’, permitting its application to all diameters without the need for adjustment.
4.2.4. Comparison with field test results and other industry methodologies
To measure the broad applicability of the proposed framework, it was applied to retrospectively analyse the results of significant load tests conducted on a range of clay types, from very soft to hard. The hindcast outcomes underscore the consistency of the framework with recorded load-displacement and p-y curves, confirming its relevance for very soft to hard clay types. The analysis reveals optimal hindcasting in very soft clays with a ‘no-gapping’ assumption and in soft to hard clays with a ‘gapping’ assumption, although gapping mandates a certain load or displacement level to manifest. Some tests on fissured, jointed, or low-loading-rate soils displayed unexpectedly soft and brittle responses, suggesting additional influencing factors.
5. Design methodologies for cyclic and fatigue loading
As of the publication date of this paper, design methodologies that address cyclic and fatigue loading on monopile foundations are still predominantly under development. There are only a handful of comprehensive design methods available in the industry that provide complete guidance on this subject, which restricts the ability to compare these methods effectively. Additionally, many research efforts relevant to this area have not been fully published at the time this paper was written. Therefore, the discussion on the cyclic response of monopiles can only be conducted on a limited basis.
5.1. New ISO/API framework for cyclic p-y curves
The new ISO/API framework for cyclic p-y curves, is based on the research conducted by Zhang (2021) which was directly adopted to ISO/API guidelines (ISO 19901-4, 2022). The framework for fatigue p-y curves, designed for normally consolidated clays, over-consolidated clays, and medium-dense sands, was initially introduced by Zakeri et al. (2016). The original intention behind its development was to address subsea well conductor fatigue issues.
5.2. PICASO project
PICASO project is a progression of PISA project, which defines developing cyclic loading methods for monopile behaviour. The project is a combination of the results of the PISA project (Abadie et al., 2018), and the Hyperplastic Accelerated Ratcheting Model (HARM) framework (Houlsby et al., 2017; Puzrin and Houlsby, 2001) through laboratory testing and theoretical development. HARM is integrated with the parameterised design approach from the PISA project and the model is calibrated to match the soil reaction curves upon initial loading and to capture the accumulated rotation observed in the PISA field tests.
5.3. REDWIN design methodology
The REDWIN project, which stands for ‘REDucing cost of offshore WINd by integrated structural and geotechnical design’, focuses on reducing the costs associated with offshore wind turbine design. The primary objective of this project was to develop specialised aero-hydro-servo-elastic codes that enable a more accurate representation of soil and foundation behaviour in the integrated analysis of these structures. The project has developed foundation design models for shallow (e.g., bucket foundations) and deep (e.g., monopiles) foundation systems to be incorporated into integrated analysis. These models have been developed with primary aim of optimising the time-domain dynamic analyses for offshore wind turbine applications.
The foundation models developed through the REDWIN project are based on a macro-element concept. The macro-element concept condenses the soil-foundation system into a singular ‘element’. This element is located either at the (1) interface between the foundation and the super-structure or at the (2) point of pile-soil interaction, representing suction caissons and pile foundations, respectively. These macro-elements capture the nonlinear soil-foundation response of the surrounding soil through force-displacement and/or moment-rotation relationships. Built upon the multi-surface plasticity framework, a fundamental concept within elasto-plastic theory, the macro-element model delineates the relationship between generalised load and its corresponding displacement increment by integrating contributions from both elastic and plastic deformation components. Consequently, the macro-element model adeptly represents the interplay of multi-directional combined loading, load-level influenced stiffness nonlinearity, and the soil hysteresis damping effect.
The primary input for this model is the nonlinear load-displacement curve. These load-displacement curves, which depict forces and horizontal displacements at specific pile locations, cannot be directly generated from p-y curves. These p-ycurves, in turn, are derived from finite element analyses, such as nonlinear pushover analysis, encompassing both soil and pile characteristics. Alternatively, p-y curves can be generated from the results of direct, simple shear (DSS) tests. For latter the reader is referred to new ISO/API p-y curves discussed later in this paper.
The foundation models developed as part of the project were formulated within the theoretical framework of multi-surface plasticity (Iwan, 1967; Mróz, 1967) where the plastic displacement is influenced by the movement of nested surfaces in the load space. The soil hardening rule was defined using piecewise linear curves (Skau et al., 2018). This relatively straightforward rheological model effectively replicates the type of hysteretic behaviour observed in real offshore wind turbine foundation systems, including kinematic hardening. This model also displays a good response to load reversals, adhering to the Masing rule. For more details on the formulation of macro-element the reader is referred to Page et al. (2017).
The process of evaluating soil damping involved a structured sequence of tasks. The first step is cyclic laboratory testing, where shear stress vs. shear strain curves were procured, thus forming the foundational basis for subsequent damping ratio calculations. Subsequently, soil-damping characteristics were determined as a function of cyclic strain levels.
The next phase included the quantification of global foundation damping, executed through finite-element analysis for designated load levels. Ultimately, the damping-load curve for the foundation is established by computing the damping at different load levels.
5.3.1. Foundation models
The mathematical formulation of the REDWIN was established through a set of finite-element analyses to capture the soil-pile (foundation) interaction. This approach was chosen over physical model testing due to cost and time constraints associated with physical tests. The yield criterion used in the models was formulated based on the results obtained from analyses. Additionally, symmetry considerations played a role in shaping the yield criterion. The models assumed associative flow and kinematic hardening, which are common concepts in plasticity theory. The yield surfaces are allowed to intersect to avoid issues related to multiaxial numerical ratcheting. The REDWIN project has advanced the development of three distinct foundation models tailored to accommodate diverse foundation types. These models offer specialised functionalities commensurate with their designated application domains.
Model 1: The model employs a simplified one-dimensional macro element featuring parallel spring elements to articulate the nonlinearity inherent in cyclic loading responses that can be used for modelling the soil response along a monopile foundation similar to p-y concept (Markou et al., 2018). Alternatively, this model can be used as a simplified 1D macro-element at the mudline level for describing the moment-rotation behaviour of a monopile or suction caisson (Aasen et al., 2017; Krathe and Kaynia, 2016). This framework also accounts for the presence of hysteretic damping. Its principal utility is facilitating pile foundation design procedures, effectively paralleling the traditional p-ymethodology.
Model 2: This model introduces a singular macro element positioned discretely at the seabed, serving as a representative model for the pile-foundation behaviour in offshore wind turbine supporting monopiles. The model can effectively capture the effects of multi-directional loading, e.g., multi-directional wave loading or wind-wave misalignment. The model encapsulates the full reaction of both the foundation and the adjacent soil. The model formulation developed from the outcomes of three-dimensional finite element analyses carried out on both the soil and the foundation. The input parameters, including pile geometry and soil conditions, were based on data obtained from an actual offshore wind farm (Page et al., 2018, 2019).
To conduct analysis using Model 2, two essential inputs are necessary. The first input encompasses the coefficients of the elastic stiffness matrix at the seabed, playing a pivotal role in predicting the foundation elastic response. It forms the foundation for understanding how the foundation behaves under purely elastic conditions. Use of semi-empirical formulations were recommended. The second set of inputs includes two distinct load-displacement curves obtained from non-linear pushover analyses, one for pure moment and another for pure horizontal load. These curves shape and size the yield surfaces within the model, contributing to the definition of the hardening law employed in the multi-surface plasticity model.
Model 3: This model was designed for shallow foundations, where a macro element is developed to represent the behaviour of shallow foundations and their interaction with the surroundings. This model can be used for gravity-based foundations with or without skirts and caisson foundations. Due to its limited applicability to monopiles, this model is not extensively discussed in this paper. For more detailed information the reader is referred to Skau et al. (2017, 2018, 2019).
6. Assessment of design methods performance for monotonic loading
In this section, design methodologies discussed in earlier parts of the paper are reviewed in depth by placing greater emphasis on the performance evaluation of these methodologies. The assessment is carried out both qualitatively and quantitatively, with the quantitative aspect involving state-of-the-art finite element (FE) modelling and analyses. Owing to the scarcity of design methodologies addressing the cyclic response of monopiles, this section only considers design methodologies for monotonic loads.
6.1. Qualitative comparison
For the qualitative comparison of design methods, the selection is restricted to methodologies that have been incorporated into design guidelines currently followed in the industry as of the publication date of this document. For detailed evaluation of the basis, limitations and contributions, readers are directed to Table 4.
| Research Background | Limitations | Contribution | |
|---|---|---|---|
| API p-y curves (Conventional) | Experimentally derived method for slender piles (L/D = 34.4) for sand and clay soil. Soil was represented by series of parallel soil springs based on Beams on Non-Linear Winkler Foundation (BNWF). | Justified for slender piles. Verified for a small number of cycles. Tested for drained soil only. Not future proven i.e., unfit for stiff piles. | Predicts a considerably softer/stiffer response than the field measurements of monopile foundations depending on soil type. |
| PISA | 1D model based on 3D FE analyses and field tests results of stiff piles from onshore dense sand and stiff clay sites. In addition to BNWF it also accounts for a distributed moments due to vertical tractions at the soil-pile interface. | Only valid for monotonic loading. It overestimates the pile stiffness at higher load levels. Although low L/D ratios were experimentally tested, maximum diameter of test piles (2 m) was still significantly lower than actual monopile size (9–11 m). Hence, the model calibration relied on extrapolation. | It can be used for various diameter piles, especially low L/D ratios. Reduced conservatism in monopile design. |
| Modified API/ISO | Developed a scaling procedure to determine the p-ycurve from the stress-strain curve obtained in a DSS test using numerical methods. Validated with site tests. | Model with tension gap, provides a much better match to the measured responses, although still on the softer side. This model does not account for distributed moments due to vertical tractions at the soil-pile interface. | Reviewing and harmonising selected methods of calculating the lateral bearing capacity factor based on conventional API method. |
6.2. Quantitative comparison
In this section, the attention is shifted to a quantitative analysis of the aforementioned design methods. This comprehensive evaluation benchmarks the performance of existing design methodologies against results from three-dimensional finite-element analyses. The scope of this study encompasses the analysis of a monopile situated in both sandy and clay soil sites. A monopile of 10 m diameter (D) with 90 mm thickness (t), embedded length (L) of 45 m was considered, resulting L/D = 4.5 and D/t = 110, which is in line with current industry practice. Load eccentricity, h, was considered between 5 ≤ h/D ≤ 15 to account for both wave and wind dominated response. Monotonically increased loading was applied to all models and resulted in pile head displacement and rotations were recorded for comparison purposes.
OPILE (OPILE, 2021) and Plaxis Monopile Designer (PLAXIS Monopile Designer, 2023) were used to evaluate the response of the monopile to conventional API p-y curves, New ISO/API p-y curves, and PISA 1D results, respectively. Soil properties used for this study are provided in Table 5.
6.2.1. Finite-element analysis
The finite-element modelling was conducted in PLAXIS 3D software (Plaxis, 2022). The geometry involved a symmetry plane, and only half of the problem was discretised in the finite-element grid (Fig. 20). The model discretised resulted in a total number of 7109 elements with a combination of hexahedral and tetrahedral elements, with the bottom boundary positioned at a 70 m depth. The rectangular boundary was situated at a longitudinal distance of 55 m and a transverse distance of 35 m. The pile is split with 280 eight-noded shell units with the steel behaviour presumed to be linear-elastic with Young's modulus, E = 200 GPa, and a Poisson's ratio, ν = 0.30. Specific interface units are added around the pile exterior to permit suitable constitutive modelling of the pile-soil interface. These are 16-noded zero-thickness elements permitting the pile and soil separation to occur, if activated, and are modelled with an elasto-plastic Mohr-Coulomb model.
 Fig. 20
6.2.2. Soil profile and characteristics
The sand and clay profiles considered in the analyses are detailed in Table 5. The soil was considered homogeneous throughout the analyses; hence no soil layering was considered. The selected model to depict the behaviour of Walney sand is the Hardening Soil Small State (HSS) modelling as outlined by Truty (2008) which is a modification of the hardening soil model that accounts for the increased stiffness of soils at small strains. For the clay soil profile, NGI-ADP was used which is the approximation of Tresca failure criteria together with a modified von Mises plastic potential function (Grimstad et al., 2012).
| Pile | D (m) | L (m) | t (m) | h (m) | L/D | D/t | h/D |
|---|---|---|---|---|---|---|---|
| CM9 | 0.762 | 3.98 | 0.011 | 9.98 | 5.25 | 70 | 13.1 |
6.2.3. Validation of 3D FE model
This verification study was conducted to check the accuracy of three-dimensional finite-element analyses (using PLAXIS 3D), PISA 1D model (using PLAXIS MoDeTo), API 2000 p-y approach (using OPILE) and new ISO/API approach (using OPILE) with an available published monopile test. For this reason, Cowder test pile CM9 from PISA project was considered (Table 6) in the verification studies. The soil characteristics of the pile were obtained from site investigation data published by Zdravković et al. (2020a).
NGI-ADP soil constitutive model was used for Cowden site CM9 test pile finite-element model which was also originally used to calibrate PLAXIS MoDeTo for PISA 1D models. Model parameters were obtained from Zdravković et al. (2020b).
The OPILE program was used for estimating pile response from other rule-based methodologies. New ISO/API (Jeanjean et al., 2017) and existing API 2000 p-y (Matlock, 1970) curves were considered.
The results database was generated through comprehensive analyses conducted using three-dimensional finite-element analysis (3D FEA), the PISA 1D model, the new ISO/API (encompassing both gapping and non-gapping scenarios), and API 2000 methodologies (Fig. 21). These results were juxtaposed with the PISA CM9 Test pile response data documented by Byrne et al. (2020) and PISA CM9 FEA outcomes from Zdravković et al. (2020b). An excellent agreement was manifested between the 3D FEA outcomes and the monitored data collated from the pile test results, along with the PISA FEA model.
 Fig. 21
A similar level of agreement was noted in the results derived from the PISA 1D model which aligned well with results published by Eleni and Harvey (2019). As anticipated, the softest response was engendered by the API 2000 method, aligning with its known methodological constraints. Whereas the new ISO/API frameworks, the no-gapping variant facilitated good congruence during small pile displacement. Conversely, the gapping framework was found to be more adept at accurately reflecting conditions of higher pile displacement.
6.2.4. Comparison of design methodologies for full scale monopile foundation
Building on the verification study results shared earlier, which validated our FE analysis, this section moves forward with modelling and analysing a full-scale monopile foundation. We considered a monopile foundation with 10 m diameter (D) with 90 mm thickness (t), embedded length (L) of 45 m was considered, resulting L/D = 4.5 and D/t = 110 aligning with current industry standards. Load eccentricity, h, was considered between 5 ≤ h/D ≤ 15 to account for both wave and wind-dominated response. The soil parameters were described in Table 5.
The results indicated that, in the context of the specified sandy soil profile, API 2000 significantly overestimates pile stiffness, a conclusion consistent across both small (0.01D) and large (0.1D) pile displacements, as well as under conditions of wave (h/D = 5) (Fig. 22a) and wind (h/D = 15) (Fig. 22b) dominated loads. Conversely, PISA 1D demonstrates a comparably more accurate alignment with 3D FEA. This is particularly evident for small pile displacements under both wind and wave-dominated loads, where there is a good agreement with 3D FEA results. In instances of large pile displacements, a marginally softer response was observed for wave-dominated loads; however, the concurrence between PISA 1D and 3D FEA results under a wind-dominated loading regime was still very similar. Additionally, the analysis yielded congruent results for pile head rotations (Fig. 22c and d), rendering an extended discussion on this parameter unnecessary within the scope of this paper.
 Fig. 22
For the clay soil site, the analysis was further expanded to include the results of the new ISO/API no-gapping and gapping responses. The data revealed that within the framework of the designated clay soil profile, API 2000 yields the highest, yet most erroneous, pile stiffness estimates. This pattern holds true for both small and large pile displacements and also under the influence of both wave (Fig. 23a) and wind-dominated (Fig. 23b) loads. In contrast, PISA 1D aligns more accurately with the 3D FEA, an observation especially pronounced for small pile displacements under both wind and wave-dominated loads, where the correlation with the 3D FEA results is notably strong. The performance of the new ISO/API is suboptimal for small displacements. For larger pile displacements, all design methodologies, except API 2000, exhibited a softer response for both wave and wind-dominated loads. Specifically, the new ISO/API gapping model resulted in the softest pile head displacement, followed closely by the no-gapping model. In comparison, the PISA 1D model offered a closer approximation, albeit with a slightly softer response. Moreover, the analysis showed consistent results for pile head rotations (Fig. 23c and d), thus negating the necessity for further discussion on this parameter within the confines of this study.
 Fig. 23
The authors also note that, in the verification study, it was observed that API2000 underestimated the pile stiffness. However, in the examined case above, API2000 overestimates the pile stiffness, albeit of the similar soil properties. This can potentially be due to the diameter effect, Hence, it demonstrates that API2000 is not reliable for piles with large diameters, which tend to be stiff in nature.
In summary, for the given soil condition in Table 5, PISA 1D model provides the closest match with three-dimensional finite-element analysis. Whereas, as believed by many researchers, API 2000 provides the most erroneous results.
7. Conclusion and discussion
This study offers a comprehensive review and analysis of monopile foundations, focusing on their current challenges and areas ripe for enhancement. The research encompasses a review of existing design methodologies, as well as a comparative assessment of these methods. Key findings from this study include.
-
1
An examination of the cost trajectories of renewable and conventional energy from 2010 to 2022 significant momentum towards renewable energy sources, making = them highly competitive. Between 2010 and 2021, the global average LCOE for offshore wind decreased by 60%. Notably, offshore wind has emerged as a viable renewable energy source to address both energy and environmental challenges.
-
2
A study was conducted utilising data from European wind farms to assess the power rate of installed wind turbines. The findings from this research clearly indicate that monopile foundations have emerged as the preferred foundation choice for offshore wind turbines in Europe. For OWTs with a capacity of less than 5 MW, 70% use monopiles but for 5–8 MW capacity, monopiles account for only 24% as jacket-type structures gain prominence.
-
3
An exhaustive review of the pile-soil interaction problem highlighted the limitations of conventional p-y curves traditionally used in the oil and gas sector. These curves were designed for slender piles, while contemporary monopiles exhibit a markedly stiffer behaviour, casting doubts on their relevance. A comprehensive analysis was conducted comparing slender and rigid monopiles. The findings indicated that this rigidity amplifies soil reaction mechanisms; hence the traditional p-y curves from the oil and gas sector are inadequate for accurately depicting rigid pile-soil interaction. According to several studies, the p-y curve method tends to underestimate pile lateral displacement and overestimate soil lateral capacity when applied to sandy soil. However, when the p-y curve method is applied to clay soil, the opposite trend was observed.
-
4
Intensive research and data analyses on the effects of cyclic loads on soil stiffness produced varied results. Present design standards lack a unified methodology for predicting rotation accumulation due to cyclic loading. Discrepancies in reporting and a reliance on experiences from offshore oil and gas fixed platforms further complicate matters. Current research initiatives seek to predict long-term deformation by measuring soil strains through element testing.
-
5
The long-term tilt phenomenon of monopiles remains enigmatic, with no specific design methodology in place. Continued research is imperative to devise “mechanism-based” design strategies for predicting long-term tilt, considering factors such as loading conditions, soil types, and turbine sizes. This is intrinsically tied to an understanding of the dynamic soil-structure interactions and their implications for performance. The conventional p-y curves were mainly derived for a small number of cycles (typically less than 200 cycles), while the OWT monopile foundation is usually subjected to a high number of loading cycles 107-108.
-
6
Most existing literature on OWTs is preoccupied with structural analysis and design considerations for environmental and operational loadings. However, there is a conspicuous dearth of research on the repercussions of extreme natural disasters, like earthquakes, and associated secondary risks. Predominantly, research gravitates towards the seismic stability of onshore structures.
-
7
A comprehensive review on soil damping for monopile foundations revealed that radiation damping is often disregarded for OWTs due to the low-frequency nature of wind and wave loadings. While efforts have been made to model pore water seepage damping, no universally accepted model seamlessly integrates stress-strain behaviour and drainage responses of monopiles without adversely affecting monopile loads. The primary damping contributor remains the inherent soil material damping (hysteresis). It is evident that much of the soil damping recorded in literature is deduced from back-analyses of overall tower damping, post factoring in other damping contributors.
-
8
The latest design methodologies aimed at bridging knowledge gaps for stiff monopiles were extensively reviewed. This includes the PISA project, REDWIN project, and new ISO/API guidelines. Each method, while unique, brings with it certain constraints and limitations. The aforementioned design methods were evaluated, and a qualitative comparison study was presented.
-
9
To assess the qualitative comparison of the design methods detailed three-dimensional finite-element analyses were conducted alongside analyses of rule-based design methodologies for sandy and clay sites. Three-dimensional finite-element analyses were verified with empirical results of a test pile installed in PISA Cowden clay site. Analyses revealed excellent agreement between 3D FEA results and both empirical data from PISA CM9 Test pile and PISA CM9 FEA findings, affirming the accuracy of 3D FEA in reflecting real-world pile behaviour. Motivated by these results, a thorough performance evaluation of the design methodologies applied to both sandy and clay soil profiles was conducted.
-
10
A performance assessment of design methodologies contrasted old API p-ycurves, the PISA 1D model, and new ISO/API p-y curves against three-dimensional finite element analyses for sandy and clay site conditions. The results yield that API p-y curves were identified as significantly suboptimal. API 2000 markedly overestimates pile stiffness in sandy soils, regardless of load type or pile displacement, while PISA 1D aligns more accurately with 3D FEA, particularly for small displacements, indicating its reliability in stiffness estimation. In clay soils, API 2000 presents the most significant overestimation of pile stiffness. In contrast, PISA 1D shows a stronger correlation with 3D FEA, especially for minor displacements, while the new ISO/API models exhibit the softest responses for larger displacements.
Funding
This research has been supported by joint funding from the University of Surreyand SLPE (Sea and Land Engineering), London.
CRediT authorship contribution statement
Sachin Jindal: Writing – review & editing, Writing – original draft, Methodology, Validation, Project management, Conceptualization. Ulvi Rahmanli: Writing – review & editing, Writing – original draft, Validation, Methodology, Conceptualization. Muhammad Aleem: Validation, Investigation, Conceptualization. Liang Cui: Writing – review & editing, Supervision. Subhamoy Bhattacharya: Writing – review & editing, Supervision.
Declaration of competing interest
The authors declare the following financial interests/personal relationships which may be considered as potential competing interests: This research has been supported by joint funding from the University of Surrey and SLPE (Sea and Land Engineering), London.
© 2024 The Authors. Published by Elsevier Ltd.